Lucky Block Price Prediction: LBLOCK/USD Price Awaiting a Breakout at $0.00470 Level
Estimated Reading Time: 3 minutes
Don’t invest unless you’re prepared to lose all the money you invest. This is a high-risk investment and you are unlikely to be protected if something goes wrong. Take 2 minutes to learn more

Free Crypto Signals Channel
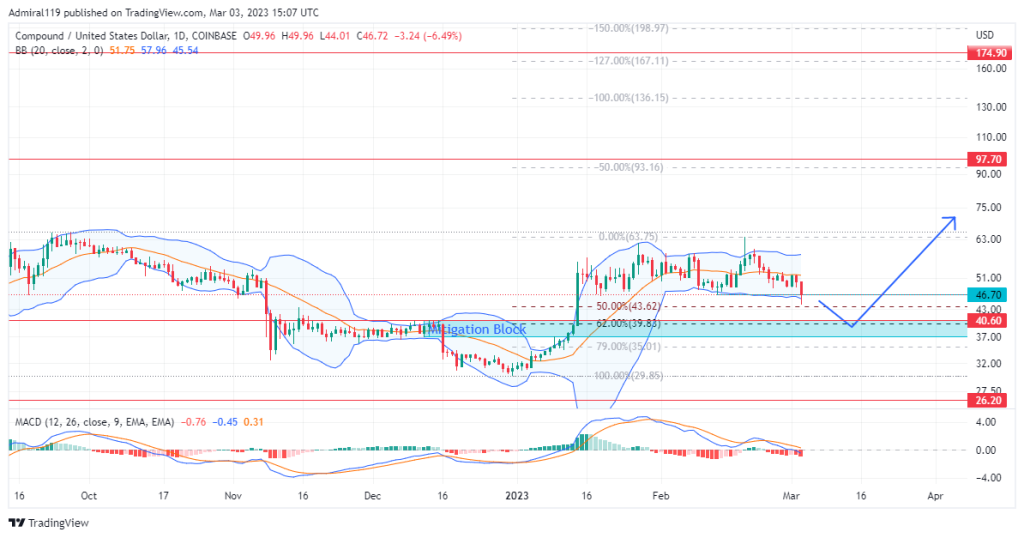
The daily chart reveals that if bulls increase their momentum, the Lucky Block price could rise towards the previous high of $0.00240 level.
LBLOCK/USD Market
Key Levels:
Resistance levels: $0.00500, $0.00550, $0.00600
Support levels: $0.00400, $0.00350, $0.00300
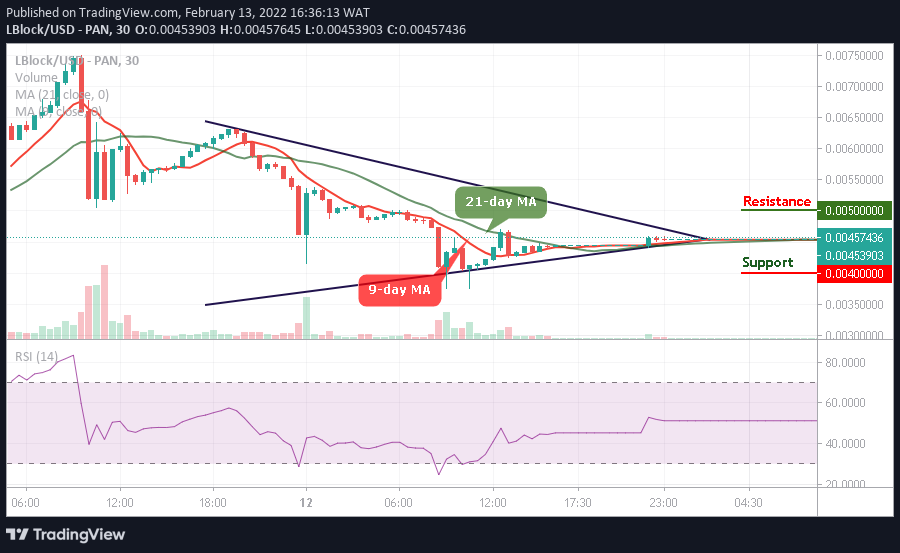
LBLOCK/USD is trading around $0.00457. In the range of the symmetric triangle, the closest support is at $0.00450, with a resistance close to $0.00460. If the market increases, additional resistance may cross above the channel. Below the triangle, traders can expect the support of around $0.00425.
Lucky Block Price Prediction: LBLOCK/USD Consolidates Before a Bullish Breakout
The Lucky Block price continues around the 9-day and 21-day moving averages. However, looking at the 30-minute chart, it is obvious that the market would rise after the sideways movement, which is noticeable for the technical indicator Relative Strength Index (14). Since a few days ago, LBLOCK/USD has been moving in the same direction as the market ranges.
Today, the coin is trading around $0.00457 by not dropping below the moving averages. However, if the Lucky Block retreat a little bit, it is likely for the coin to touch the support level of $0.0400, $0.00350, and $0.00300, but the traders show expect a bullish spike towards the resistance levels of $0.00500, $0.0550, and $0.00600 respectively.
LBLOCK/USD Medium-term Trend: Ranging (15 Minutes Chart)
On the 15-minute chart, the support level of this range is built around $0.00440. The resistance is set at $0.00455 because the market price is still changing under the 9-day and 21-day moving averages which could touch the support level of $0.00435 and below. Technically, the price is expected to an uptrend as the technical indicator Relative Strength Index (14) slides into the oversold region.
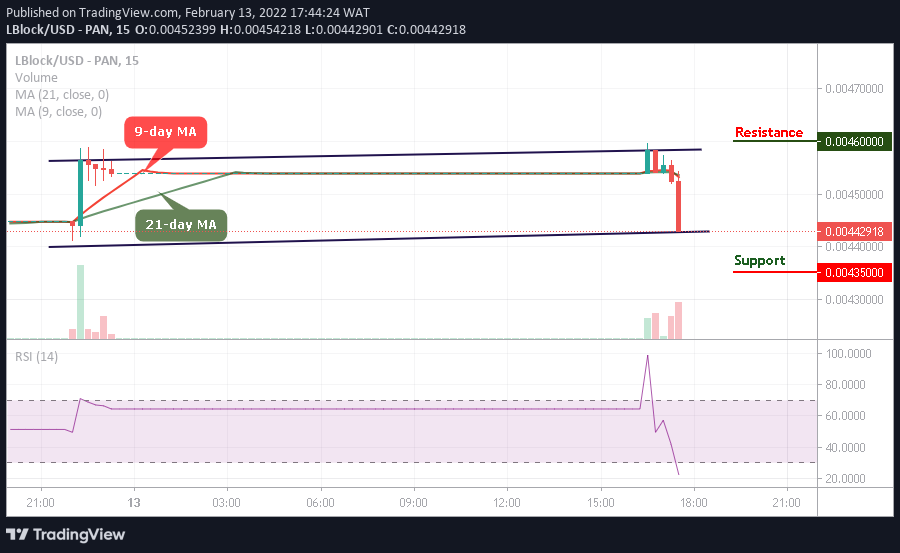
However, immediately the signal line leaves the oversold zone, LBLOCK/USD would begin an upward movement. Therefore, any bullish cross above the moving averages may hit the resistance level of $0.00460 and above.
Read more: