Lucky Block Price Prediction: LBLOCK/USD Falls to $0.000289; Good Time to Buy
Estimated Reading Time: 3 minutes
Don’t invest unless you’re prepared to lose all the money you invest. This is a high-risk investment and you are unlikely to be protected if something goes wrong. Take 2 minutes to learn more

Free Crypto Signals Channel
The Lucky Block price prediction drops to touch the daily low of $0.00289 as the price dips for new buyers to surface.
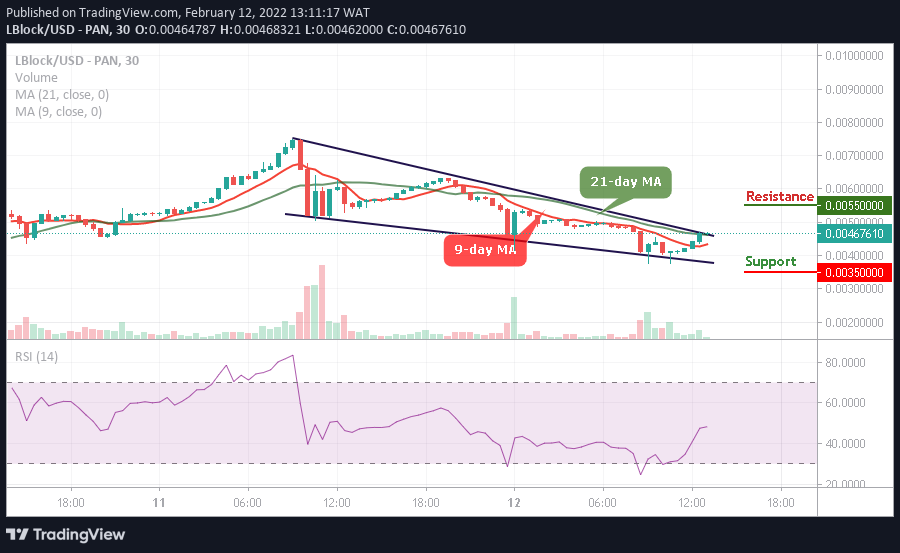
LBLOCK/USD Medium-term Trend: Ranging (30 Minutes Chart)
Key Levels:
Resistance levels: $0.00550, $0.00600, $0.00650
Support levels: $0.00350, $0.300, $0.00250
LBLOCK/USD is now recovering above the resistance level of $0.00450 after the coin touches the daily low at $0.000289 below the lower boundary of the channel. However, the buyers quickly grab the Lucky Block (LBLOCK) and push it to cross above the 9-day and 21-day moving averages. Therefore, if the sellers bring the market further lower once again, more buyers and expected to buy the dip as the coin prepares for more green candles.
Lucky Block Price Prediction: Buyers Ready to take LBLOCK to the Upside
Looking at the 30-minute chart, the Block Lucky price is now retracing back to the upside, but buyers should watch for the next bearish signals for them to buy the dips. On the other hand, the coin may fall more if the technical indicator Relative Strength Index (14) falls below 40-level as the coin may experience new buyers coming into the market. Any further supports may be located at $0.00350, $0.00300, and $0.00250.
However, should the buyers hold the current support of $0.00435 and begin to climb higher; the bulls can expect immediate resistance to be located at $0.00245. Any further bullish movement above the upper boundary of the channel may hit the resistance level of $0.00550, $0.00600, and $0.00650.
LBLOCK/USD Medium-term Trend: Bearish (15 Minutes Chart)
On the 15-minute chart, the Lucky Block price may cross below the 9-day and 21-day moving averages, but this may give new buyers to enter into the market. Nevertheless, the existing buyers are also expected to buy any dip as the market gathers momentum to begin another bullish movement.
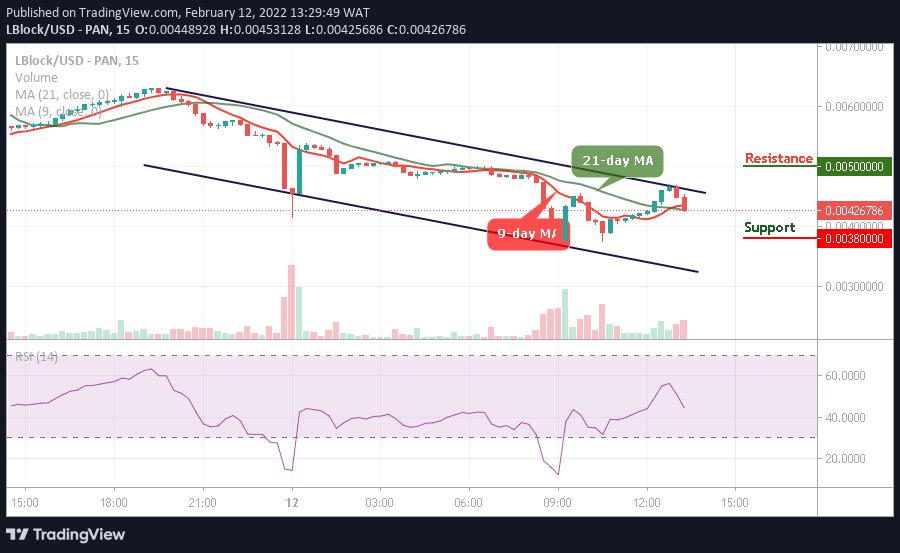
From above, if the buyers push the price above the upper boundary of the channel, higher resistance lies at $0.00500 and above. Moreover, should the coin retreats below the moving averages, another support may come at $0.00380 and below while the Relative Strength Index (14) stays above 45-level to suggest a sideways movement.
Read more: