0x Protocol (ZRX/USD) Finds Footing at $0.36, Eyes $0.40 Resistance
Estimated Reading Time: 3 minutes
Don’t invest unless you’re prepared to lose all the money you invest. This is a high-risk investment and you are unlikely to be protected if something goes wrong. Take 2 minutes to learn more
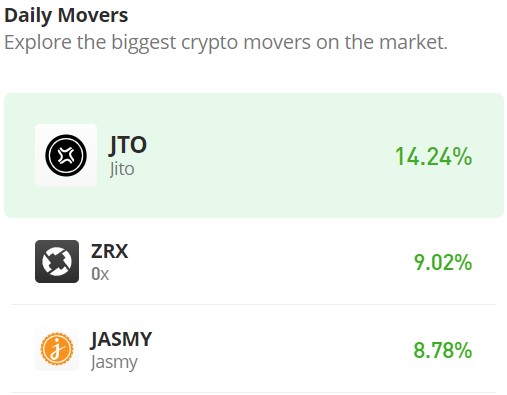
The outlook for the 0x Protocol market is positive today, with a substantial gain of 9.02%. Following a significant bull market that pushed the price to $0.36 on Monday, the market traded sideways from Tuesday to Thursday. However, today’s market saw bulls gain the upper hand, suggesting that the price might surge to $0.40. Despite this bullish trend, the appearance of a small upper shadow on today’s candlestick indicates emerging bearish sentiment, which may create resistance near the $0.40 level.
0x Protocol Market Data
- ZRX/USD Price Now: $0.376
- ZRX/USD Market Cap: $318 million
- ZRX/USD Circulating Supply: 847 million ZRX
- ZRX/USD Total Supply: 1 billion
- ZRX/USD CoinMarketCap Ranking: #171
Key Levels
- Resistance: $0.4, $0,45, and $0.5
- Support: $0.33, $0.30, and $0.25.
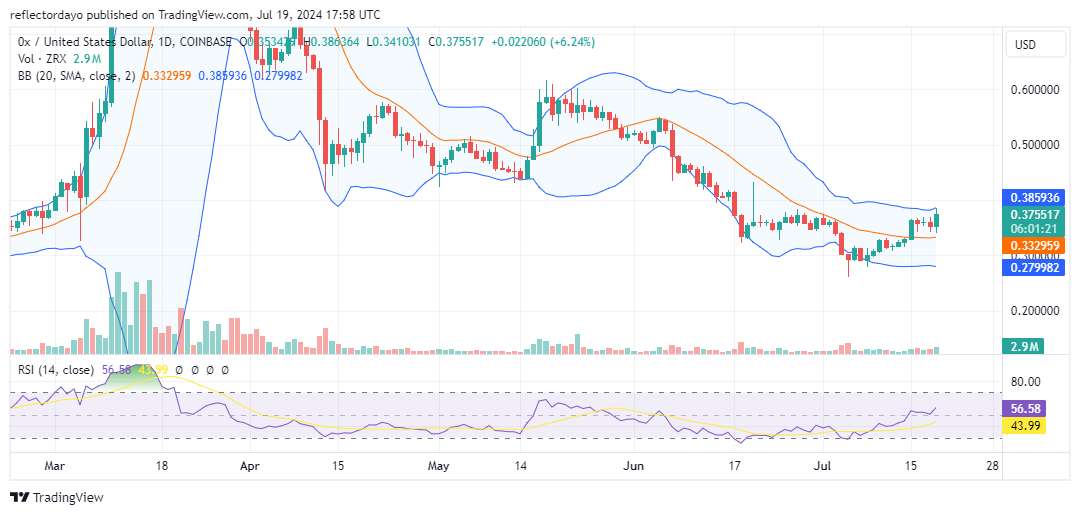
0x Protocol Market Through the Lens of Indicators
As the market approaches the $0.40 price level, some traders are becoming bearish and preparing to take profits. This explains the small upper shadow on the bullish candlestick. Due to the minimal price pullback, the upper band of the Bollinger indicator is not reflecting much bullish activity, indicating that the market is still ranging sideways. However, breaking above the $0.38 price level would demonstrate that bullish traders are serious. Despite today’s strong bullish price movement, the trading volume remains low, as indicated by the small trade volume histograms. This raises the question of how the market is showing such compelling bullish crypto signals. It is possible that influential 0x Protocol market players are accumulating assets to influence the market in their favor.
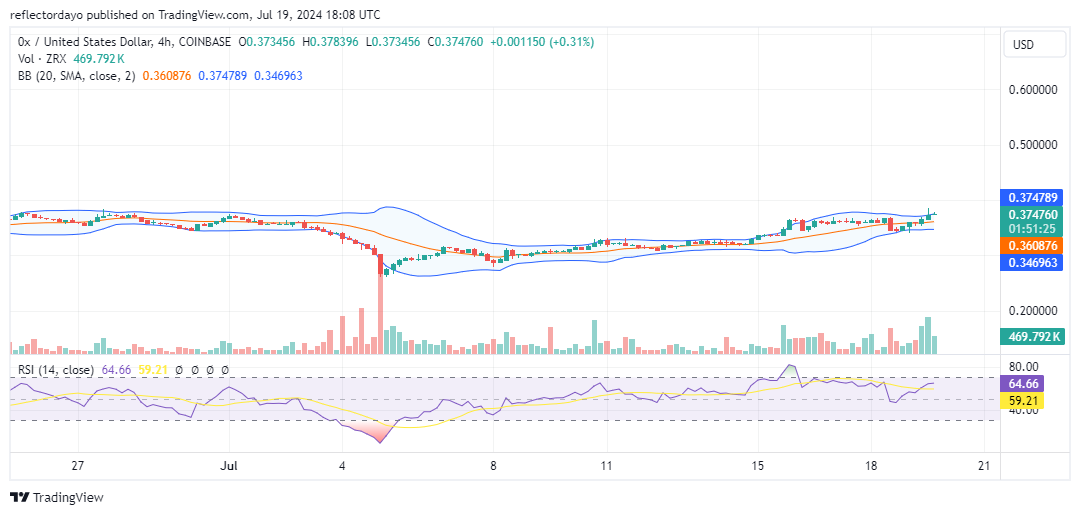
ZRX/USD Price Prediction: 4-Hour Chart Analysis
The trading volume tells a different story from the perspective of the 4-hour chart. Here, the trade volume histograms are strong and substantial. However, the concern is that the candlesticks appear relatively small compared to the histograms. This implies that, despite the trading activity, bulls and bears are becoming evenly matched. This balance could signal an impending market reversal. Notably, the last candlestick on the chart resembles a gravestone doji. Investors should wait and observe the market’s direction before making any decisions.