Compound (COMP/USD) Prepares to Consolidate Above the $50 Price Level
Estimated Reading Time: 3 minutes
Don’t invest unless you’re prepared to lose all the money you invest. This is a high-risk investment and you are unlikely to be protected if something goes wrong. Take 2 minutes to learn more
The $50 level has been a major support, a bullish stronghold where the Compound bulls attempted to halt the last downward price movement. However, as bearish pressure intensified, the price action dipped slightly below $50 and even tested the $40 threshold. At this point, the market reversed course and moved upward. In a remarkable performance, the price rallied and surged above the $50 level. Currently, new market developments suggest potential consolidation above $50 due to the emergence of resistance near the $52 level.
Compound Market Data
- COMP/USD Price Now: $52.19
- COMP/USD Market Cap: $437 million
- COMP/USD Circulating Supply: 8.4 million
- COMP/USD Total Supply: 10 million
- COMP/USD CoinMarketCap Ranking: #137
Key Levels
- Resistance: $55, $60, and $65
- Support: $48, $45, and $40.
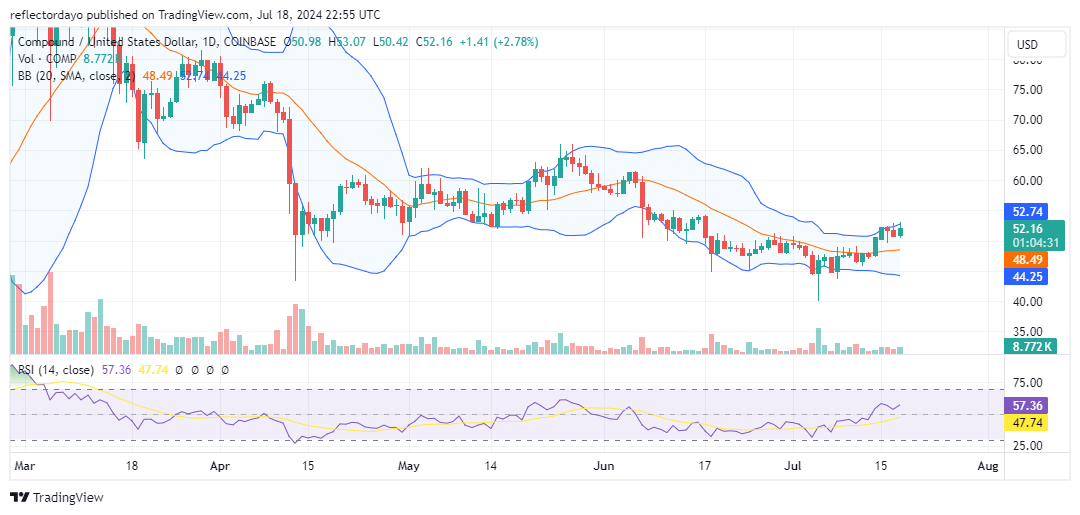
Compound Market Through the Lens of Indicators
From the crypto signal daily chart, we observe that following the remarkable bull run that pushed the market above the $50 level, resistance emerged at $52. Since then, the market has been moving sideways, maintaining a narrow price channel between $50 and $52. If the next daily session continues to trade within this narrow range, the Bollinger Bands may converge, reflecting the reduced price bandwidth of the market. However, the fact that the Bollinger Bands still maintain a significant bandwidth indicates that the market remains volatile, suggesting that the $50 level may not hold. If both the $50 support level and the $52 resistance level hold, the Bollinger Bands will converge. Conversely, if the price action breaks below the $50 level, the consolidation may maintain movement between $45 and $52.
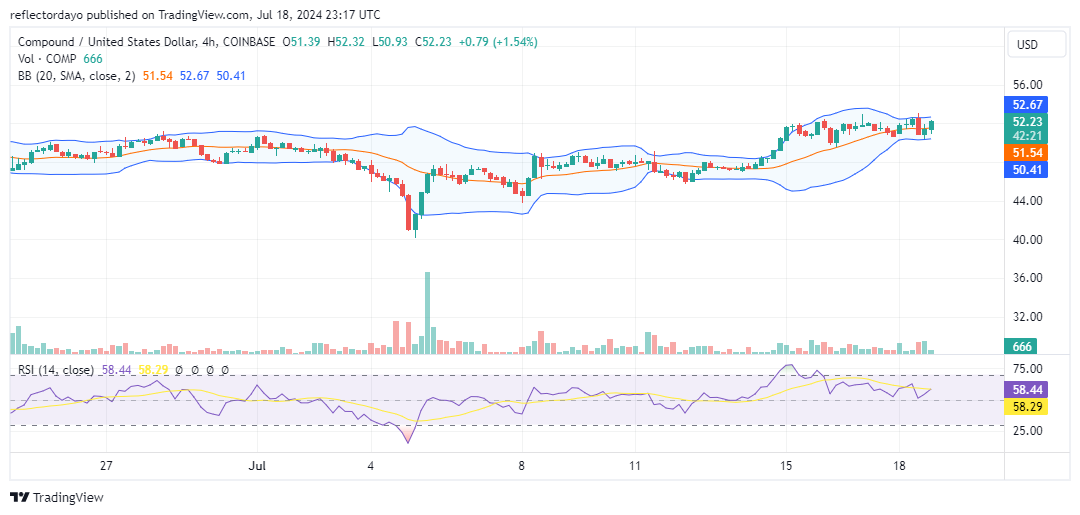
COMP/USD Price Prediction: 4-Hour Chart Analysis
The possibility of the Bollinger Bands converging, as indicated in the daily chart analysis, appears to have materialized in the perspective of the 4-hour chart. Both the support and resistance levels have held steady, resulting in sideways price action around the $52 level. If this trend continues, it will likely be reflected in the daily chart. Additionally, the trading volume suggests ongoing consolidation, as the small histogram readings indicate a low likelihood of significant market moves.