Immutable X (IMX/USD) Reclaims $1.50, Sets Sights on $1.60
Estimated Reading Time: 3 minutes
Don’t invest unless you’re prepared to lose all the money you invest. This is a high-risk investment and you are unlikely to be protected if something goes wrong. Take 2 minutes to learn more
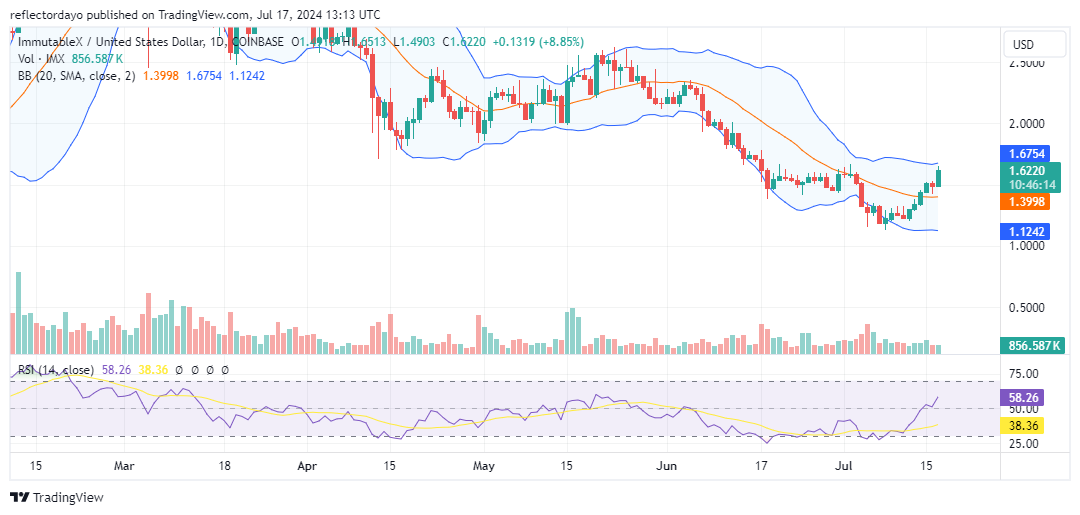
The Immutable X (IMX/USD) market has been in a downtrend since the beginning of June. For most of the first half of the month, the market experienced continuous declines. However, by June 17, a support level had emerged. Some traders adopted a bullish bias at the critical $1.50 price level. Despite this, bearish pressure persisted, pushing the market below this support level, with the bulls finding solid support at $1.178. From there, the price rallied and reclaimed $1.50 as a support level.
Immutable X Market Data
- IMX/USD Price Now: $1.62
- IMX/USD Market Cap: $2.5 billion
- IMX/USD Circulating Supply: 1.5 billion
- IMX/USD Total Supply: 2 billion
- IMX/USD CoinMarketCap Ranking: #41
Key Levels
- Resistance: $1.70, $1.77, and $1.80
- Support: $1.45, $1.40, and $1.35.
Immutable X Market Through the Lens of Indicators
The bullish Immutable X traders are now focused on reaching the $1.60 price level, despite the noticeable bearish resistance at this point. Indicators suggest that the downtrending market is transitioning from a sideways range, as the current support level is now well above the 20-day moving average. This crypto signal indicates strong bullish momentum that could push the market beyond the $1.60 resistance. Additionally, the RSI line is at 58, reflecting increasing bullish momentum. However, for a clear recovery trend to establish, the price needs to break above this resistance level. Traders should closely monitor the $1.60 price level, as a breakout here could generate positive sentiment and further drive the upward movement.
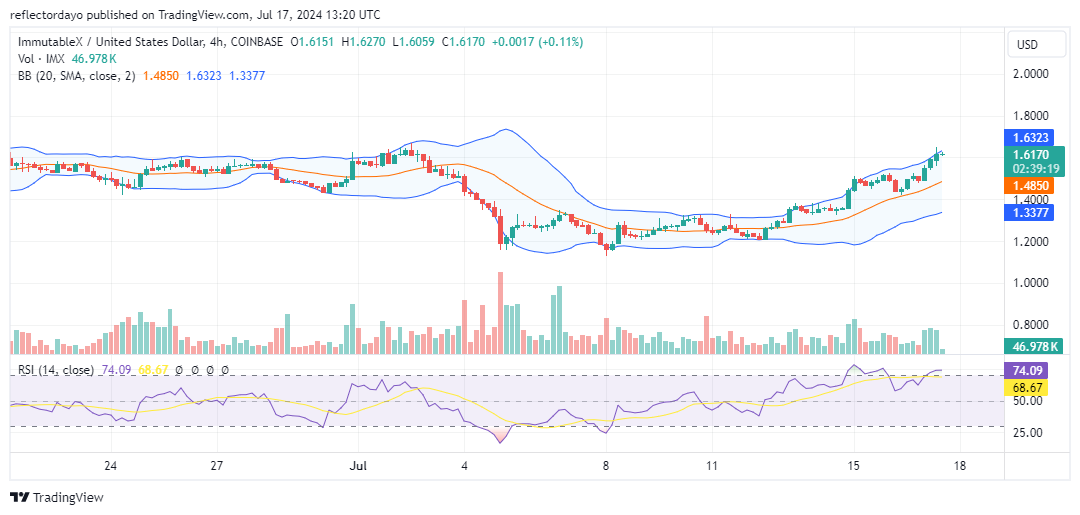
IMX/USD Price Prediction: 4-Hour Chart Analysis
The indicators on the 1-hour chart show a more bullish market, with higher lows becoming increasingly clear and consistent. Currently, the market has surged above the $1.60 price level but is facing resistance at $1.65. It is likely that the market will secure another higher low above this level. However, investors should proceed with caution, as the current candlestick representing the session is a plus sign doji. This type of candlestick, appearing at the height of a bull run, can signify a potential reversal due to the equilibrium between demand and supply. Watch closely to see if a higher low forms here. Additionally, the Relative Strength Index (RSI) indicates an overbought market, further suggesting the possibility of a market reversal.