Zcash (ZEC/USD) Trying to Establish Itself Above the $27 Price Level
Estimated Reading Time: 3 minutes
Don’t invest unless you’re prepared to lose all the money you invest. This is a high-risk investment and you are unlikely to be protected if something goes wrong. Take 2 minutes to learn more

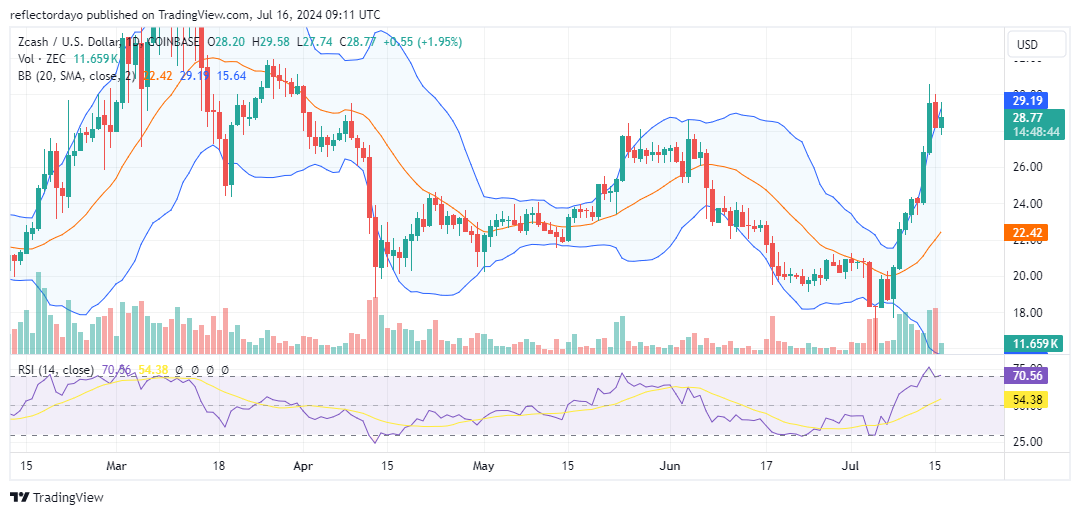
The $27 price level emerged as a bearish resistance in May following the earlier bull run this year. This resistance level has acted as a strong hurdle, preventing further advancement of the Zcash bull market. The bulls showed resilience for a while, finding support near the $26 price level. However, this support was short-lived, as bearish pressure soon caused a breakdown, plunging the market to $20 and subsequently to $16. At the $16 price level, the market found a pivotal bounce and rallied significantly.
Zcash Market Data
- ZEC/USD Price Now: $28.65
- ZEC/USD Market Cap: $467 million
- ZEC/USD Circulating Supply: 16 million
- ZEC/USD Total Supply: 16 million
- ZEC/USD CoinMarketCap Ranking: #125
Key Levels
- Resistance: $30.00, $30.50, and $31.00
- Support: $26.00, $25.50, and $25.00.
Zcash Market Through the Lens of Indicators
Significant buying activity was triggered at the $16 price level, leading to a substantial price increase as traders rushed into the bull market. This action was depicted on the chart by significant bullish candlesticks, though some had minimal upper shadows. This indicates that while bearish pressures were present in some sessions, the majority of traders were bullishly biased. According to the Bollinger Bands, this surge is leading to increased volatility, with the bands diverging. This crypto signal suggests that although bulls are currently dominating, a significant price pullback may occur when the price reaches a major resistance level.
The bull run has been so strong that the market has broken through the previous resistance level at $27. Typically, such a breakout above a major resistance level triggers more bullish interest among traders. However, the market is now facing significant resistance at the $30 price level. The resilient bulls have turned the former $27 resistance into support, but the question remains: will the uptrend continue at this critical juncture?
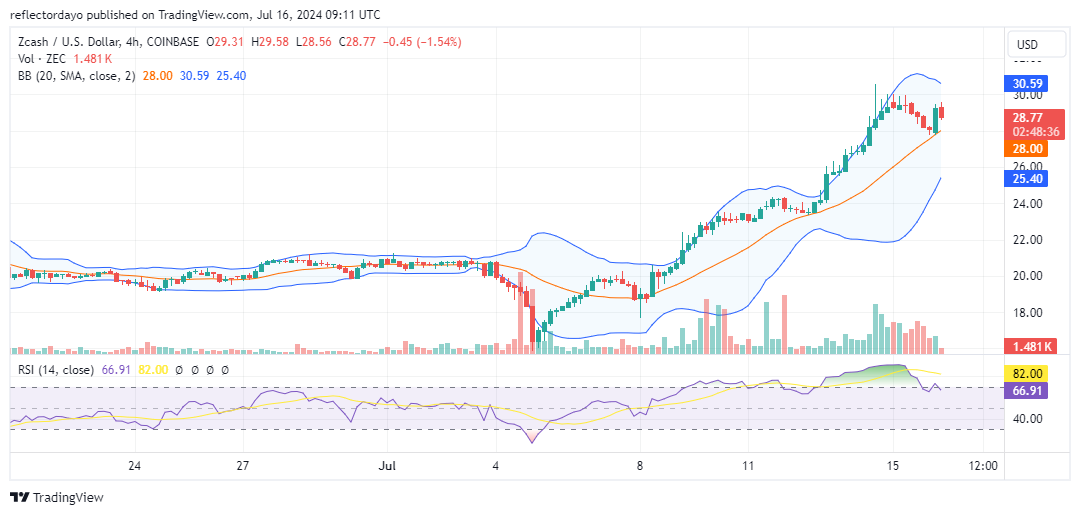
ZEC/USD Price Prediction: 4-Hour Chart Analysis
The price action appears to have settled into an elevated price channel ranging between $28 and $30, with both the resistance and support levels proving formidable. Consequently, the price action indicates a propensity for consolidating within this range for a while before potentially finding its next direction. However, with the RSI line showing a heavily overbought market, the chances of a bullish continuation are reduced.