Wall Street Memes (WSM) Price Rises; Bounce Holds Firm
Estimated Reading Time: 3 minutes
Don’t invest unless you’re prepared to lose all the money you invest. This is a high-risk investment and you are unlikely to be protected if something goes wrong. Take 2 minutes to learn more

Wall Street Memes Price Prediction – September 20
Wall Street Memes (WSM) price action holds firm as bullish momentum extends. Indicators suggest stability in the bounce, with underlying strength pointing to potential continuation, while short-term consolidations may provide firmer bases for further upside movement.
Wall Street Memes coin continues to demonstrate resilience, with bullish indicators reinforcing the ongoing upward drive and strengthening investor confidence. The sustained firmness of the bounce underscores underlying strength, while brief consolidations are likely to reinforce the base for extended upside potential in the coming sessions.
WSM/USD Market
Key Levels
Resistance levels: $0.0006, $0.0007, $0.0008
Support levels: $0.0004, $0.0003, $0.0002
WSM/USD – 4-hour Chart
The WSM/USD medium-term chart showcases that the crypto-economic market rises as the bounce holds firm.
The Bollinger Bands are shaping a constructive flagship pattern, clustering near favorable long-entry zones with strengthening momentum, reinforcing breakout potential. Meanwhile, the Stochastic Oscillators reflect limited bearish signals, suggesting bulls are steadily regaining control of market direction.
Could the Price Sustain Its Rise as the Bounce Holds Firm Amid Bullish Signals?
While the WSM/USD market’s price rise and firm bounce reflect bullish momentum, long-term position holders should exercise caution, as potential consolidations or reversals may challenge sustained upward continuation in the meantime.
Although the price rise and firm bounce indicate prevailing bullish momentum, long-term holders should remain cautious. Technicals suggest potential consolidations or corrective pullbacks, which could limit sustained upside. Prudent monitoring is advised to avoid exposure to abrupt reversals within broader market fluctuations.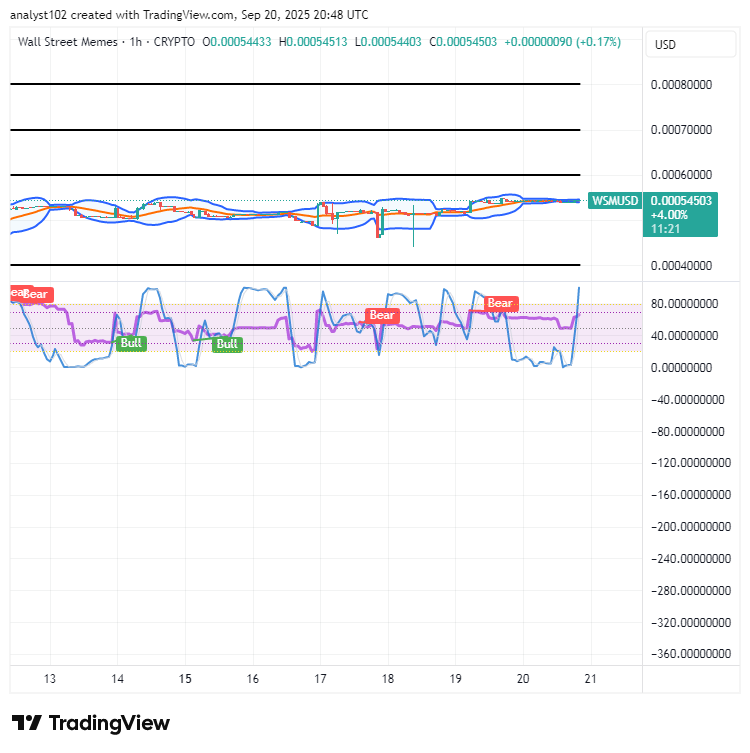
WSM/USD 1-hour chart
The 1-hour chart of the WSM/USD market depicts crypto-economic market rises; the bounce holds firm.
The Bollinger Bands are extending and gradually tilting to the upside, signaling strengthening momentum. Meanwhile, the Stochastic Oscillators are swerving under bearish signals, potentially clearing the pathway for a renewed bullish drive toward higher levels.
Unlock exciting new trading opportunities with flexible 1-25x adjustable leverage. Plus, they’re officially live on Bybit Futures Grid Bot algorithmic powerhouse! Start maximizing trades confidently today.
🚀 BIGTIMEUSDT & WSMUSDT Contracts now on Bybit!
— Bybit (@Bybit_Official) October 12, 2023
Dive into new trading opportunities with 1-25x leverage. Plus, they’re now on Bybit Futures Grid Bot! Start trading now.
📈 BIGTIME: https://t.co/FAQlbhnzAh
📈 WSM: https://t.co/pb2y2AfMBE#CryptoTrading #Bybit