Polkadot (DOT/USDT) Faces Rejection at $9.359; Signals a Downturn
Estimated Reading Time: 3 minutes
Don’t invest unless you’re prepared to lose all the money you invest. This is a high-risk investment and you are unlikely to be protected if something goes wrong. Take 2 minutes to learn more
Polkadot Long-term Analysis: Bullish
Polkadot’s recent breakout above $8.000 has positioned it as one of the top-performing altcoins in the crypto market. However, the technical indicators suggest caution, as an overbought condition could lead to a short-term correction towards $7.678.
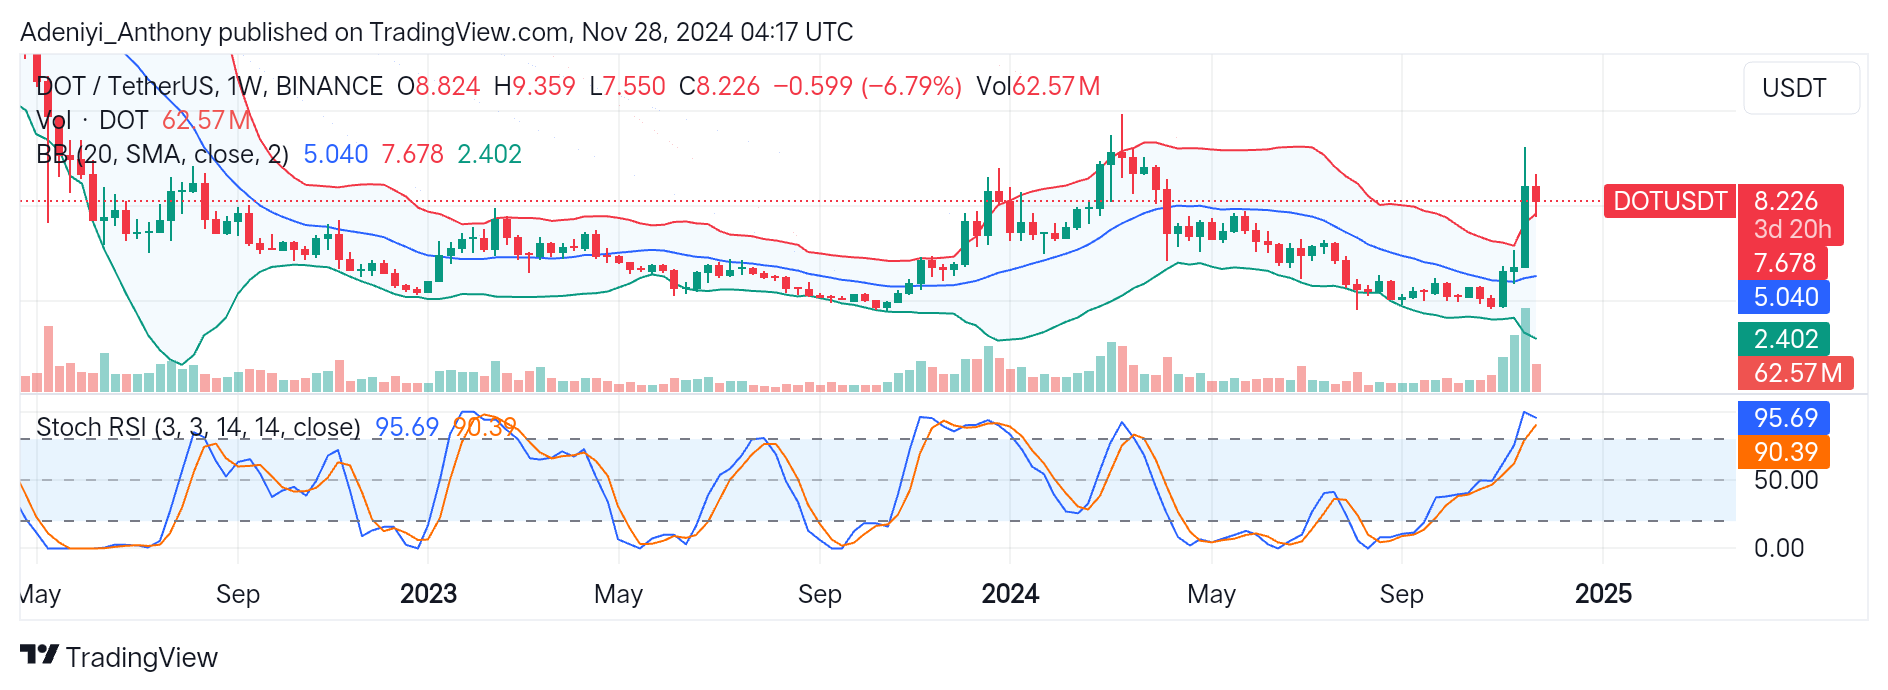
Recently, DOT/USDT has shown significant price action, surging to a high of $9.359 before facing rejection. However, the pair remains in a bullish position after breaking out from a long-term consolidation phase between $2.402 and $5.040.
To this end, traders must trade cautiously as the bullish pressure seems to be waning.
Currently, Polkadot is trading at $8.226 and down by 6.79% compared to the previous trading session.
Technical Indicator
Major Resistance Level: $9.359, $10.000, and $11.000
Major Support Levels: $7.678, $5.040, and $2.402
Polkadot Technical Analysis
In recent times, the price of Polkadot against the Tether has broken the upper Bollinger band at $7.678, signaling a strong bullish trend. However, current price action suggests sellers are beginning to mount pressure on the market as the pair is experiencing a pullback to the $7.678 level.
On the other hand, the Stochastic RSI readings of 95.69 and 90.39 indicate the pair is deep in the overbought zone. This shows heightened buying pressure but historically suggests a correction might be on the horizon.
However, the widening of the Bollinger band indicates increased volatility and potential price movement; a break below the $7.678 level could lead to a retest of lower supports. Conversely, a break above the $9.359 level would ensure the testing of a higher resistance level at $10.000.
DOT/ETH Analysis: What’s Next?
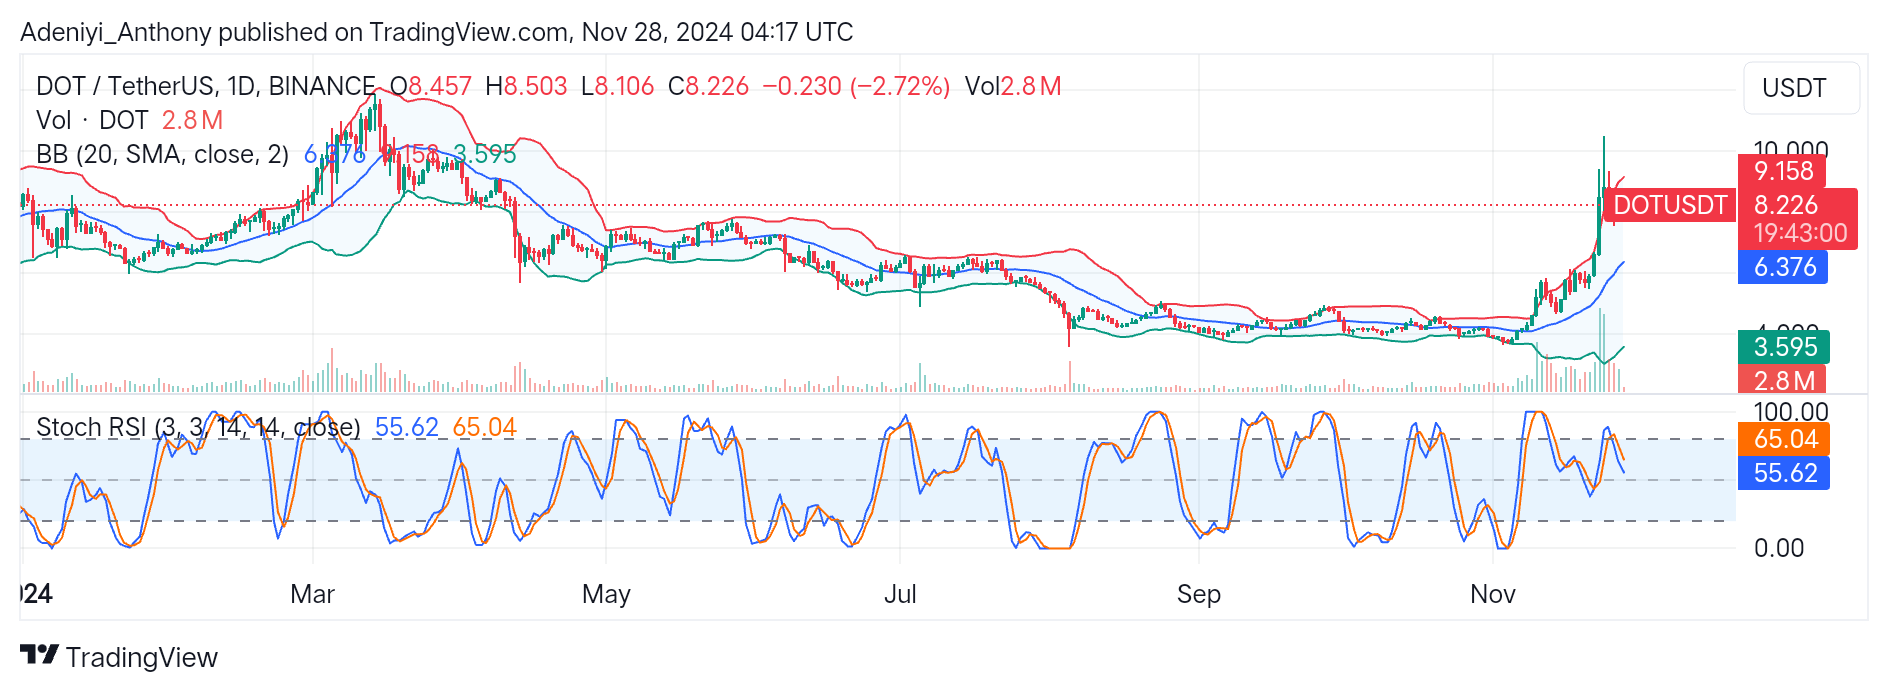
DOT/USDT has seen a significant price increase on the daily period in recent days; the daily chart shows a robust advance to $9.158 before reverting to the present level. Although recent market movement indicates a pause in the rising trend as an overbought condition continues to build, DOT is still positive despite this slight dip. However, traders should keep an eye on the $9.158 as the Bollinger bands signal an imminent breakout, and watch for consolidation around $8.000 as the Stochastic RSI points to a possible drop.
Therefore, a break below the former may lead to price retracing further to the mid-band at $6.376, while a break above the latter would indicate a target towards the $10.000 psychological level.
To this end, caution is needed, as a break below $6.376 may indicate the start of a broader correction.
You can purchase crypto coins here. Buy LBlock