Polkadot (DOT/USDT) Targets $6.287 Upper Level Despite Growing Overbought Concern
Estimated Reading Time: 3 minutes
Don’t invest unless you’re prepared to lose all the money you invest. This is a high-risk investment and you are unlikely to be protected if something goes wrong. Take 2 minutes to learn more
Polkadot Long-term Analysis: Bullish
Polkadot against the Tether in previous weeks has experienced a significant upward movement after operating around $3.293 in late October. This suggests a growing bullish interest in the digital asset and a representation of the broader crypto bull market, as seen in the coin’s 8.64 billion market capitalization.
Furthermore, the recent breakout above the mid-band towards the upper level at $6.287 suggests growing bullish momentum. However, amid this buying interest, the Stochastic RSI suggests a potential short-term retracement might be on the horizon, as the lines point to an extreme overbought condition.
Currently, DOT/USDT is trading at $5.736, which represents a 5.75% positive trade over the previous session.
Technical Analysis
Major Resistance Levels: $6.287, $7.000, and $7.500
Major Support Levels: $5.000, $4.970, and $4.000
Polkadot Technical Analysis
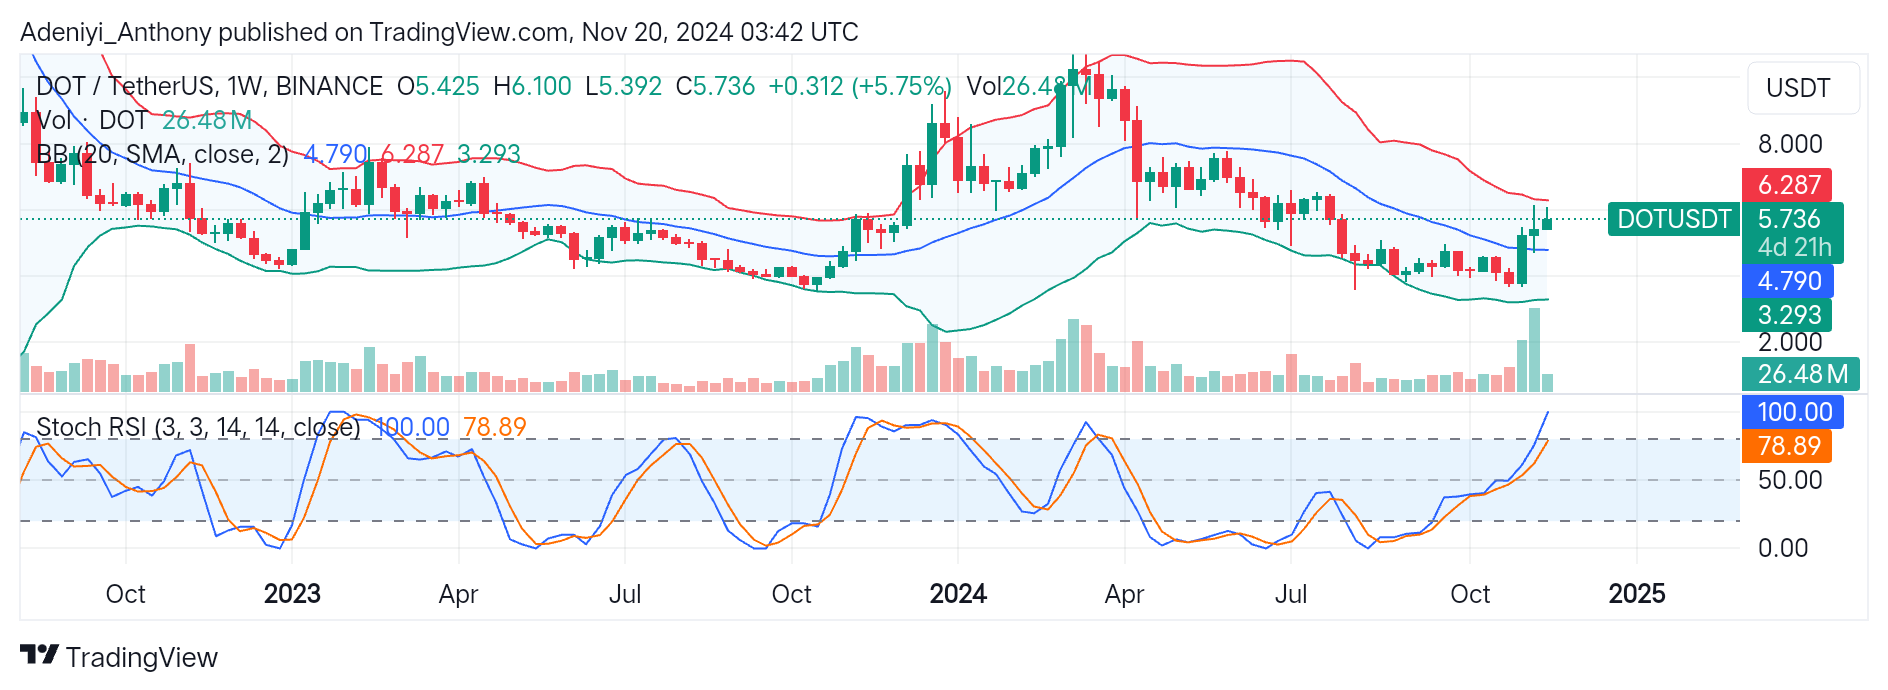
The analysis of Polkadot against the Tether on a weekly timeframe presents a bullish outlook after breaking through the 20-week dynamic resistance at $4.970. The recent price action suggests the pair aims to break above the $6.287 where the upper band is positioned. However, with the increasing trading volume and the current 26.48 million, more buying opportunities will be open if the price can hold above the upper resistance, provided the current momentum is sustained.
On the other hand, the Stochastic RSI suggests the pair operates deep in the overbought region, with the blue lines reading 100 while the orange is at 78.89. This shows that DOT/USDT might need to retrace temporarily before attempting further upside movement if the bulls fail to sustain the momentum.
Therefore, traders should monitor spikes in subsequent volume to confirm the pair’s impending move, but maintaining the $5.00 level will be crucial to preserving upward potential in the coming weeks.
DOT/USDT Analysis: What is Next?
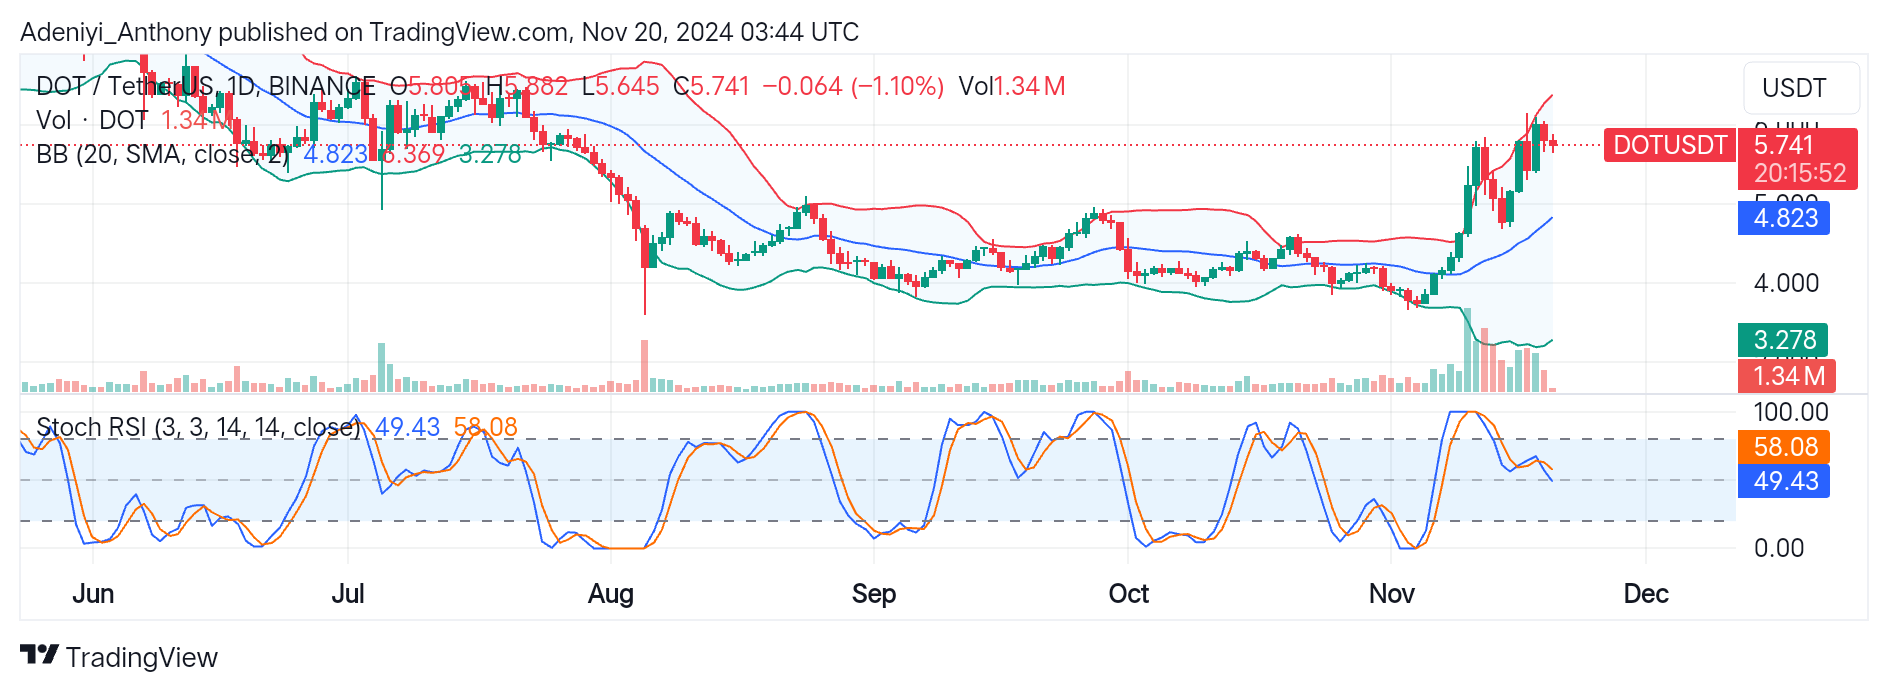
The analysis of DOT/USDT on a daily timeframe reveals a slight consolidation after a bullish rally in previous sessions. Though the pair is currently trading at $5.741, DOT on the daily chart is experiencing a price dip of 1.10%. This indicates some profit-taking is taking place. However, despite this, the overall market condition remains positive as the price still holds above the $5.000 psychological level.
The Stochastic RSI at the bottom of the chart suggests the pair is in a cooling phase, signaling the pair might consolidate before taking the next directional move. However, with the declining trading volume, a fall below $5.000 could impact the coin in coming trading sessions.
You can purchase crypto coins here. Buy LBlock