Litecoin (LTC/USD) Market Hovers Between $55 and $50
Estimated Reading Time: 3 minutes
Don’t invest unless you’re prepared to lose all the money you invest. This is a high-risk investment and you are unlikely to be protected if something goes wrong. Take 2 minutes to learn more
Litecoin Price Prediction – October 18
There has been a continual low-active trading situation in the LTC/USD business economy as the crypto market hovers between $55 and $50 lines over long-term sessions. In the last several hours into today’s transaction deals, price features within $52.222761 and $51.340450 value lines at a minute negative percent of 0.05.
LTC/USD Market
Key Levels:
Resistance levels: $55, $60, $65
Support levels: $50, $45, $40
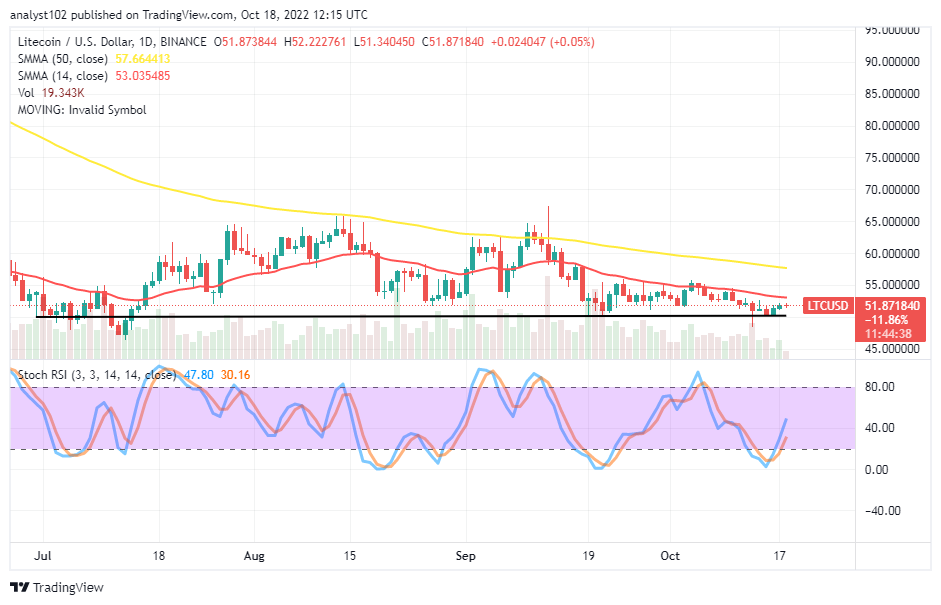
LTC/USD – Daily Chart
The LTC/USD daily chart reveals the crypto market hovers between $55 and $50 trading levels. The horizontal line remains drawn at the $50 to mark the point price tends to make an upswing severally while the need for a necessary downward-declining motion rises. The 14-day SMA indicator is at $53.035485, underneath the $57.664413 value line of the 50-day SMA indicator. The Stochastic Oscillators have crossed northbound from the oversold region to the 30.16 and 47.80 range lines.
Which of the bearish or the bullish trending capacity outlook is the LRC/USD market now maintains?
The possible trending capacity outlook that the LTC/USD trade currently keeps appears, running into a rallying motion as the crypto market hovers between $55 and $50 trading zones. At the moment of writing these analytics, buyers are seemingly to surge through the resistance value of the smaller SMA trend line with a lesser attraction that can obtain a sustainable upward stance in the long run.
On the downside of the technical analysis, buyers’ reactions in the market may successfully push the price to former resistances near below the trend line of the 50-day SMA. The Stochastic Oscillators’ postures at a high-range spot will likely portend a near-exhaustion signal against getting some ups at a particular point where such a condition arises. Sellers may leverage any correction that can occur around the 14-day SMA in the near time for a while.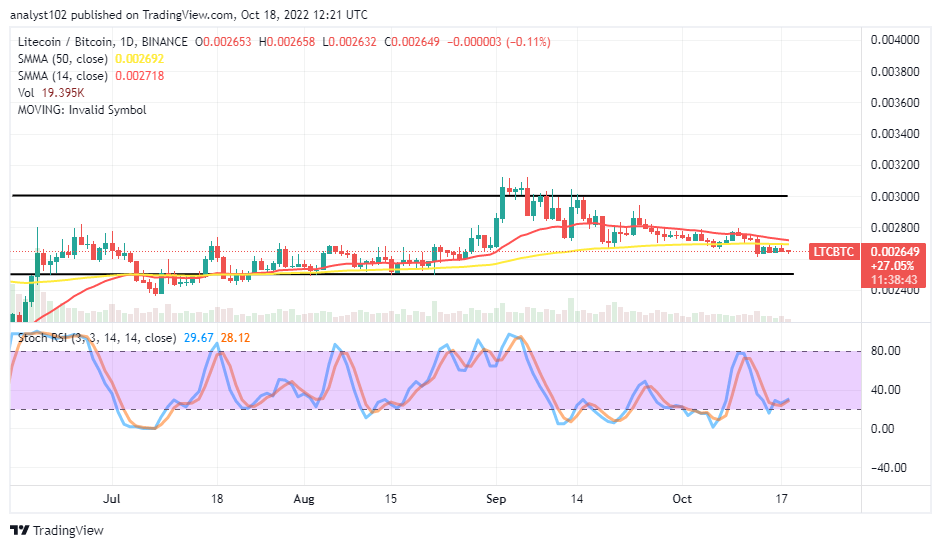
LTC/BTC Price Analysis
In comparison, Litecoin appears to be in the mode of struggling to build a base against Bitcoin’s trending ability from a point near underneath the bigger SMA trend line. In other words, the cryptocurrency pair market hovers between a space of the 50-day SMA indicator and the lower horizontal line drawn to mark the minimum low spot of the base crypto trading instrument as it pairs with its counter-trading tool. The Stochastic Oscillators have crossed northbound from the range of 20 to 28.12 and 29.67 range points. That showcases the former crypto is somewhat preparing to move against its latter-trading crypto in no time.
Note: Cryptosignals.org is not a financial advisor. Do your research before investing your funds in any financial asset or presented product or event. We are not responsible for your investing results.
You can purchase Lucky Block here. Buy LBLOCK