Litecoin (LTC/USD) Price Experiences a Significant Downswing
Estimated Reading Time: 3 minutes
Don’t invest unless you’re prepared to lose all the money you invest. This is a high-risk investment and you are unlikely to be protected if something goes wrong. Take 2 minutes to learn more
Litecoin Price Prediction – November 16
It currently recorded that the LTXC/USD price experiences a significant downswing after losing the upward momentum in the last preceding days’ session. As of writing, the crypto-economic price trades around $235 to maintain a negative percentage rate of about 10.30.
LTC/USD Market
Key Levels:
Resistance levels: $275, $300, $325
Support levels: $200, $175, $150
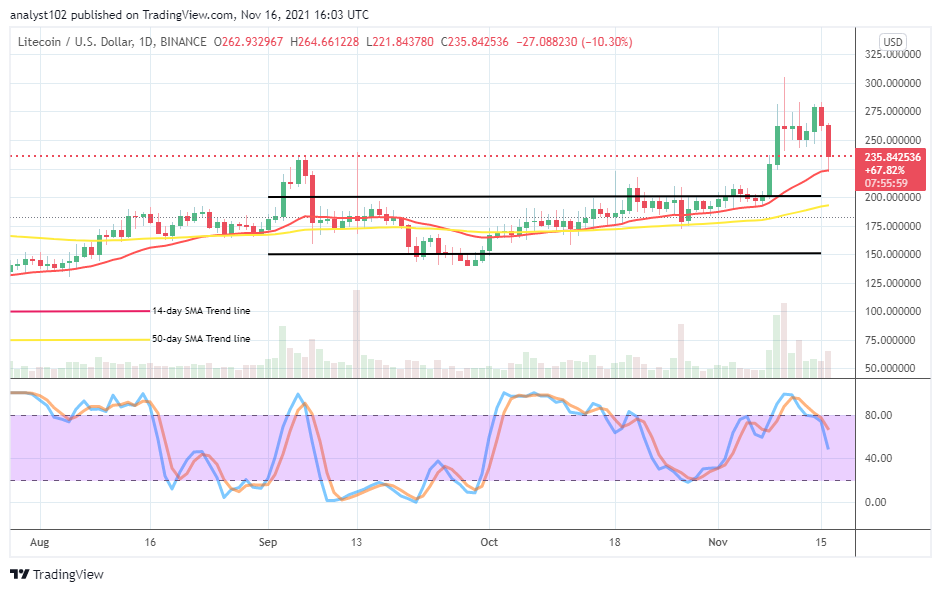
LTC/USD – Daily Chart
The LTC/USD daily chart reveals the crypto-economic price as experiences a significant downswing presently to denote the re-surface of the market bears. All those trading happenings are yet notably being on the buy signal sides of the SMA trend lines. Today’s bearish candlestick in the process of making has touched the smaller SMA indicator from the top. The 50-day SMA trend line is underneath the 14-day SMA trend line. The Stochastic Oscillators have crossed southbound to closely point to the downside. That indicates that some degrees of lowering moves are ongoing.
Are there still rooms for more downs as the LTC/USD price experiences a significant downswing?
Currently, it appears that the LTC/USD pair market will still have to go down in a completion of the current depression occurrence as price experiences a significant downswing. As a result of that assumption, bulls are to exercise some levels of patience by suspending their coming back for a while until a formation re-builds to give back a bullish candlestick at a lower trading spot afterward.
On the downside of the technical analysis, the LTC/USD market bears are now in the spirit of building a sell wall off above the trend lines of the SMAs. The major resistance trading seemingly has been to have genuinely found around $275 level. The trend line of the 14-day SMA must breach to the south side to let the market set the motion back into its some of the previous lower trading zones especially, the range-bound levels of $200 and $150.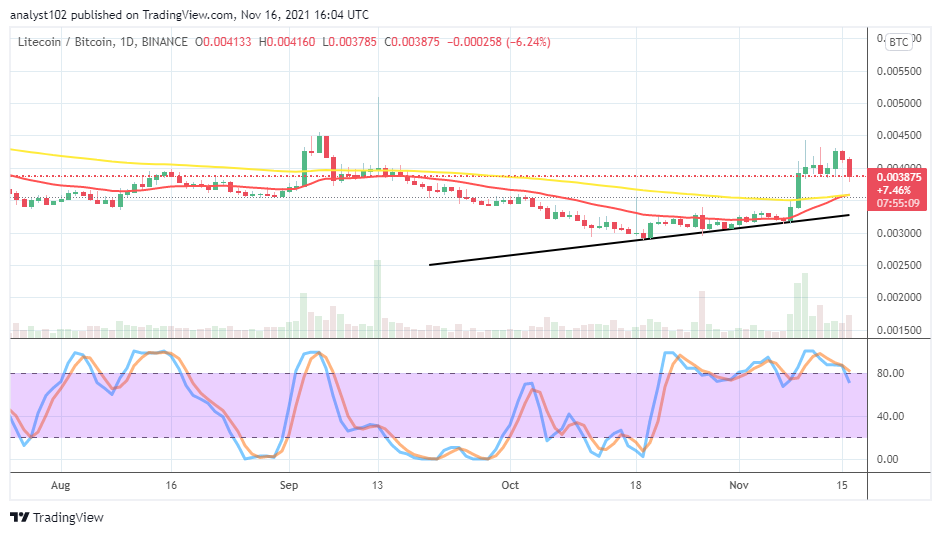
LTC/BTC Price Analysis
In comparison, the trending forces of Litecoin against Bitcoin has showcased by the price analysis chart, portends that the base crypto appears to lose the stance to the counter crypto at a higher trading level. .Presently, the currency pair price experiences a significant downswing capable of projecting lowering movements as once witnessed as it happened during the last September 6th and 7th sessions. The 50-day SMA trend line has been touched by the 140-day SMA trend line from beneath. The Stochastic Oscillators have slightly crossed the lines southbound at the range of 80. With the emerging bearish candlestick presently, the base crypto will likely go more under-trending as paired with the flagship counter crypto in the subsequent sessions.
Note: Cryptosignals.org is not a financial advisor. Do your research before investing your funds in any financial asset or presented product or event. We are not responsible for your investing results.
You can purchase crypto coins here. Buy Tokens