Litecoin (LTC/USD) Price Trades Below $60 Resistance
Estimated Reading Time: 3 minutes
Don’t invest unless you’re prepared to lose all the money you invest. This is a high-risk investment and you are unlikely to be protected if something goes wrong. Take 2 minutes to learn more

Free Crypto Signals Channel
Litecoin Price Prediction – July 26
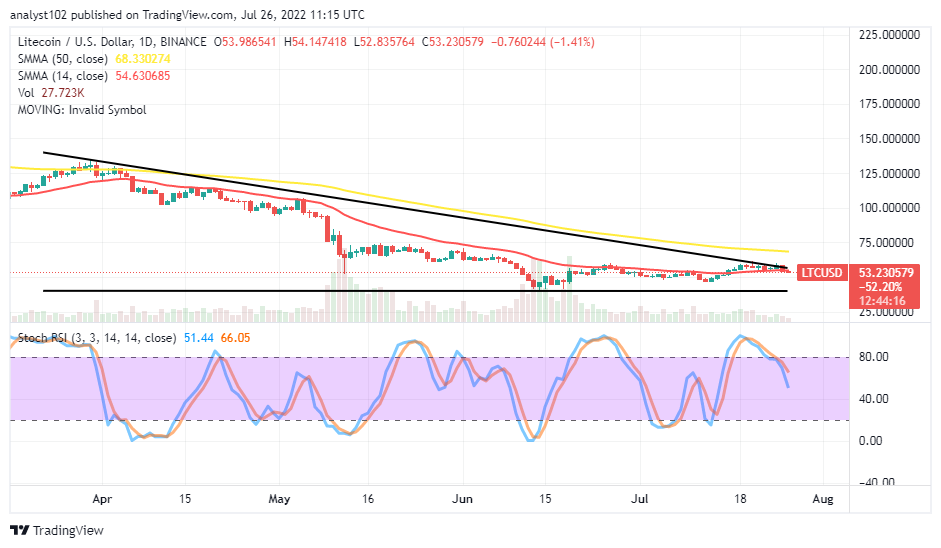
After some rejections at a higher-trading line, the LTC/USD market price now trades below the $60 resistance point. The less active up and down moves have featured between $54 and $52 points at a 1.41 percentage rate negative.
LTC/USD Market
Key Levels:
Resistance levels: $60, $70, $80
Support levels: $40, $35, $30
LTC/USD – Daily Chart
The LTC/USD daily chart reveals the crypto-economic price trades below the $60 resistance level. The 14-day SMA indicator is underneath the 50-day SMA indicator. The bearish trend line drew southward closely over the trend line of the smaller SMA. The Stochastic Oscillators have crossed northbound from the overbought region to reach somewhere around the 50 range. And they are positioned slantingly southbound against some of the range points to denote a declining force is in place.
Will the LTC/USD market get corrected toward the $40 support level
The LTC/USD market bears have to heighten their presence on the current downward force to get a decline of $40 as the crypto price trades below the $60 resistance point. As there has been a movement to the south side, long-position placers are to stay off for a while. A touch of a lower-trading zone with a bullish candlestick emerging afterward may be a warning signal against further depreciation motion.
On the downside of the technical analysis, as there has been that the LTC/USD market has prevailed upon by bears’ actions at the expense of bulls’ weaknesses, short-position placers should be wary of late entry. As it has been, the critical support level is at $40. Therefore, bears may still possibly push the crypto trade down to the value line. It can also be too early to suggest a rebound from the current trading spot.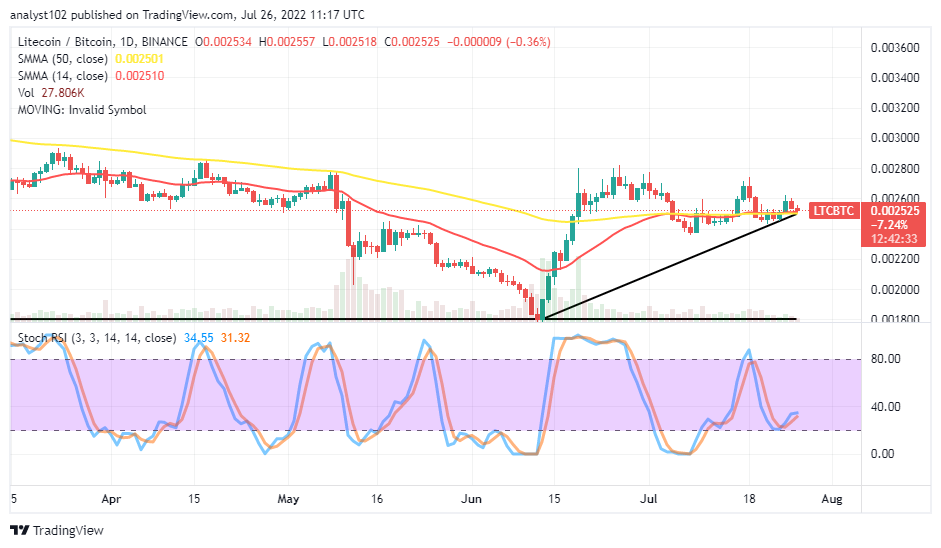
LTC/BTC Price Analysis
Ln comparison, Litecoin has consistently featured at a higher-trading spot on the price analysis chart against Bitcoin. The cryptocurrency pair price trades below a higher-resistance zone over the trend lines of the SMAs. The 14-day SMA indicator has conjoined with the 50-day SMA indicator from beneath. And the bullish trend line drew to uphold the mindset the pairing cryptos appear at a high zone. The Stochastic Oscillators have moved southward to touch the 20 range. But, they are seeming, trying to close the lines below the 40 range. It seems the base crypto risk the moment of going down against the counter crypto if the SMA trend lines breached southward afterward.
Note: Cryptosignals.org is not a financial advisor. Do your research before investing your funds in any financial asset or presented product or event. We are not responsible for your investing results.
You can purchase Lucky Block here. Buy LBLOCK: