Cardano (ADA) Holds Above $2.02 Support, Resumes Uptrend
Estimated Reading Time: 2 minutes
Don’t invest unless you’re prepared to lose all the money you invest. This is a high-risk investment and you are unlikely to be protected if something goes wrong. Take 2 minutes to learn more
Cardano (ADA) Long-Term Analysis: Bearish
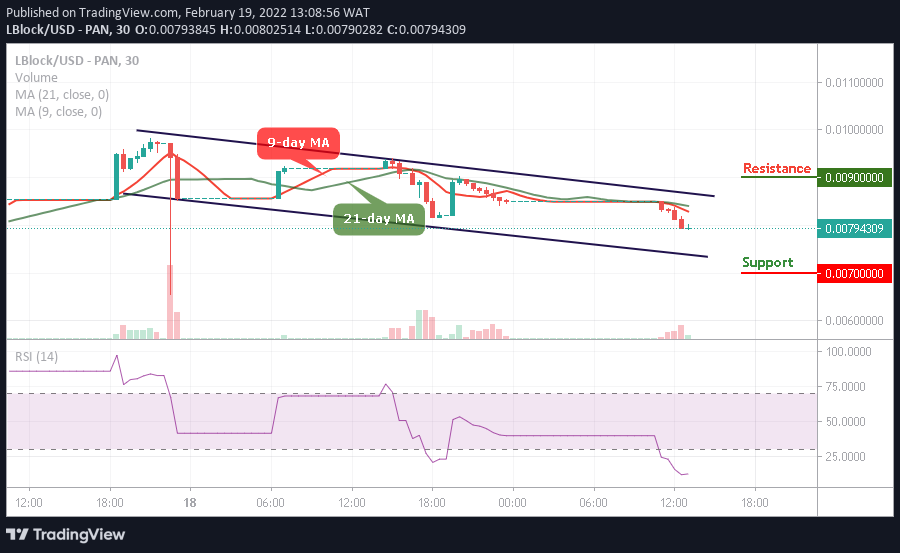
Cardano’s (ADA) price is in an upward move as price breaks above the 21-day SMA. The upward movement will be accelerated if price breaks above the 50-day SMA. ADA is currently rising on the upside. The upside momentum will resume if ADA/USD is sustained above the $2.60 high. However, if Cardano faces rejection at the recent high, the market will decline to the previous low at $1.91. The downtrend will resume if price breaks below the previous low.
Cardano (ADA) Indicator Analysis
Cardano is at level 50 of the Relative Strength Index period 14. It indicates that there is a balance between supply and demand. The cryptos price is above the 21-day SMA but below the 50-day SMA. The altcoin is still in the downtrend zone. The altcoin is above the 80% range of daily stochastic. The market is in a bullish momentum.

Technical indicators:
Major supply zones: $2.0, $2.20, $2.40
Major demand zones: $1.40, $1.20, $1.00
What Is the Next Direction for Cardano (ADA)?
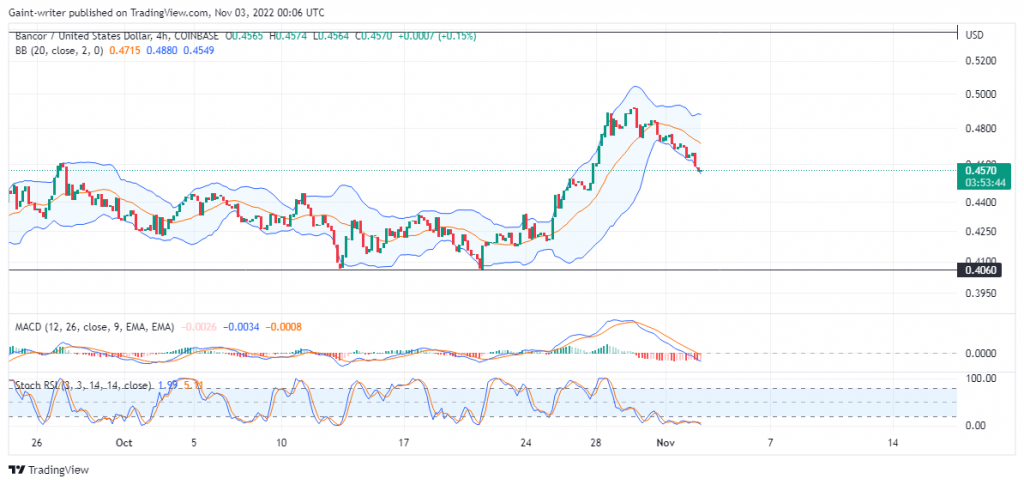
Cardano is in an upward move. The Fibonacci tool has indicated a further upward movement of the coin. On the 4- Hour chart, the altcoin has broken above the moving averages. Meanwhile, on October 1 uptrend; a retraced candle body tested the 61.8% Fibonacci retracement level. The retracement indicates that ADA is likely to rise to level 1.618 Fibonacci extension or level $2.38.

You can purchase crypto coins here. Buy Token
Note: Cryptosignals.org is not a financial advisor. Do your research before investing your funds in any financial asset or presented product or event. We are not responsible for your investing results