Chainlink’s Uptrend Halts at $21 as It Commences a Sideways Move
Estimated Reading Time: 3 minutes
Don’t invest unless you’re prepared to lose all the money you invest. This is a high-risk investment and you are unlikely to be protected if something goes wrong. Take 2 minutes to learn more

Chainlink (LINK) Long-Term Analysis: Bullish
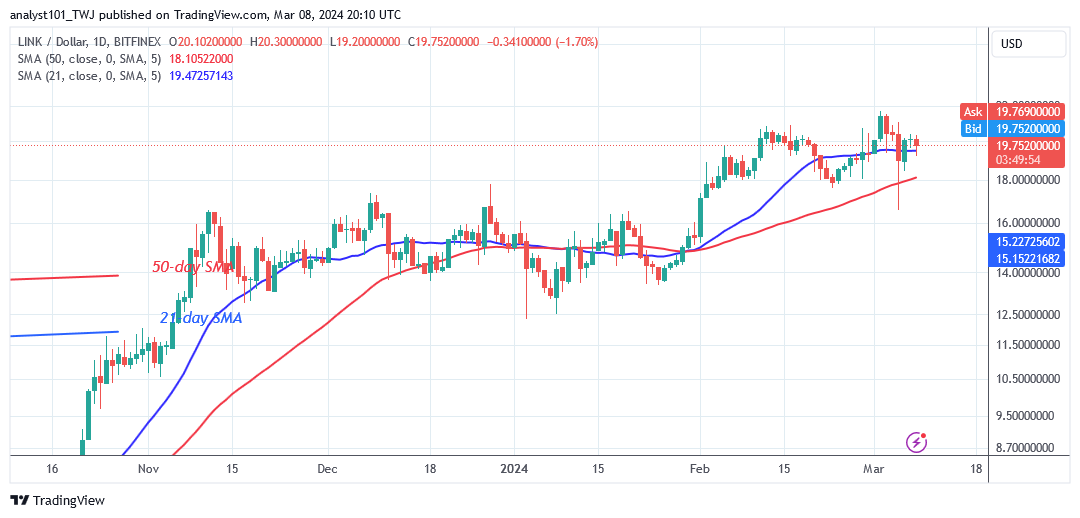
Chainlink’s (LINK) price is rising above its moving average lines as it commences a sideways move. On February 12, the cryptocurrency price rose to a high of $20.84 but failed to break above the resistance at $21. The altcoin has been in a sideways trend for the past month, failing twice to break through the recent high. On March 3, the LINK price went above the moving average lines, hitting the resistance level of $21.
The altcoin fell above the $17 support, but bulls bought the dips. The cryptocurrency’s price has recovered above the moving average lines, although it remains below its recent high. Chainlink is worth $19.68 at the time of writing. It will rally to a high of $25.61 if the current resistance is broken. However, if the bulls fail to breach the recent high, the altcoin will trade between $17 and $22.
Technical indicators:
Major Resistance Levels – $8.00, $10.00, $12.00
Major Support Levels – $6.00, $4.00, $2.00
Chainlink (LINK) Indicator Analysis
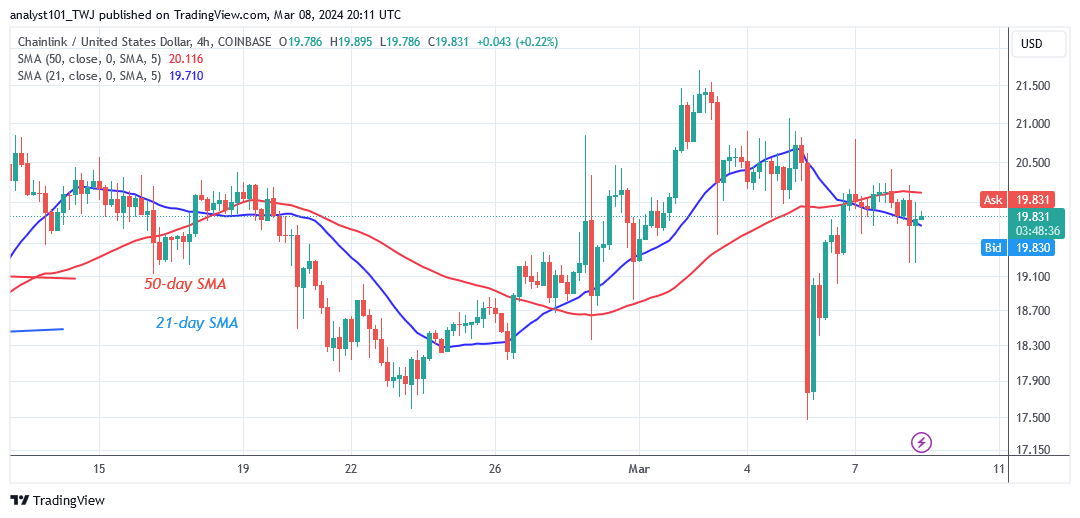
The cryptocurrency price is above the moving average lines after bulls purchased dips. The rising trend has been hampered by resistance near $21. The horizontal moving average lines are trending up, indicating an uptrend. Price movement is now restrained by Doji candlesticks.
What Is the Next Direction for Chainlink (LINK)?
Chainlink’s price is declining below the moving average lines as it commences a sideways move. The upward trend has been hampered by the moving average lines. Currently, it is caught between the moving average lines. Given that the price of LINK is trapped in a range, a sideways move is probably imminent.
However, on the daily chart, the price bars are higher than the moving average lines. This suggests that the cryptocurrency signal is likely to be positive.
You can purchase Lucky Block here. Buy LBLOCK
Note: Cryptosignals.org is not a financial advisor. Do your research before investing your funds in any financial asset or presented product or event. We are not responsible for your investing result