Chainlink Breaks the $20 High to Resume Its Bullish Ascent
Estimated Reading Time: 2 minutes
Don’t invest unless you’re prepared to lose all the money you invest. This is a high-risk investment and you are unlikely to be protected if something goes wrong. Take 2 minutes to learn more

Chainlink (LINK) Long-Term Analysis: Bullish
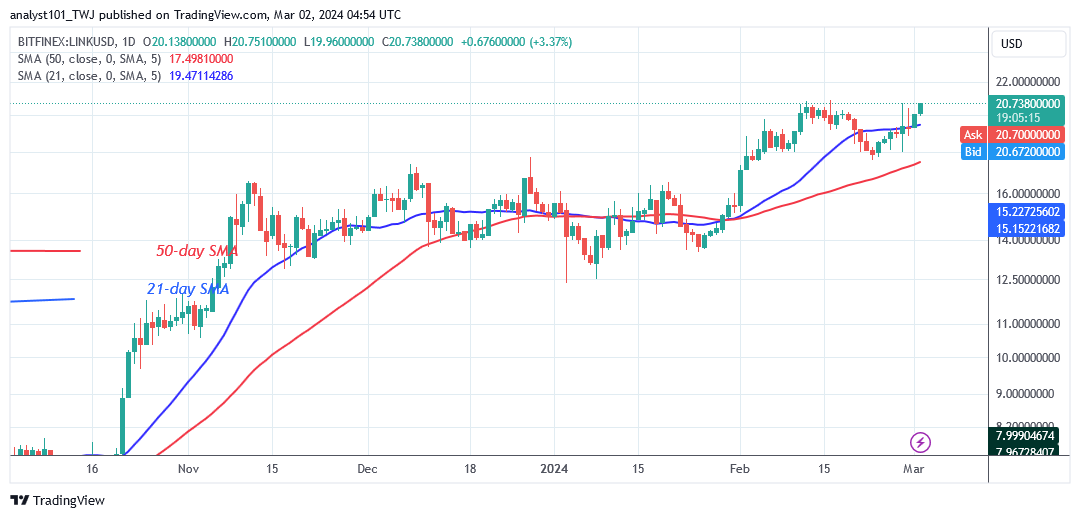
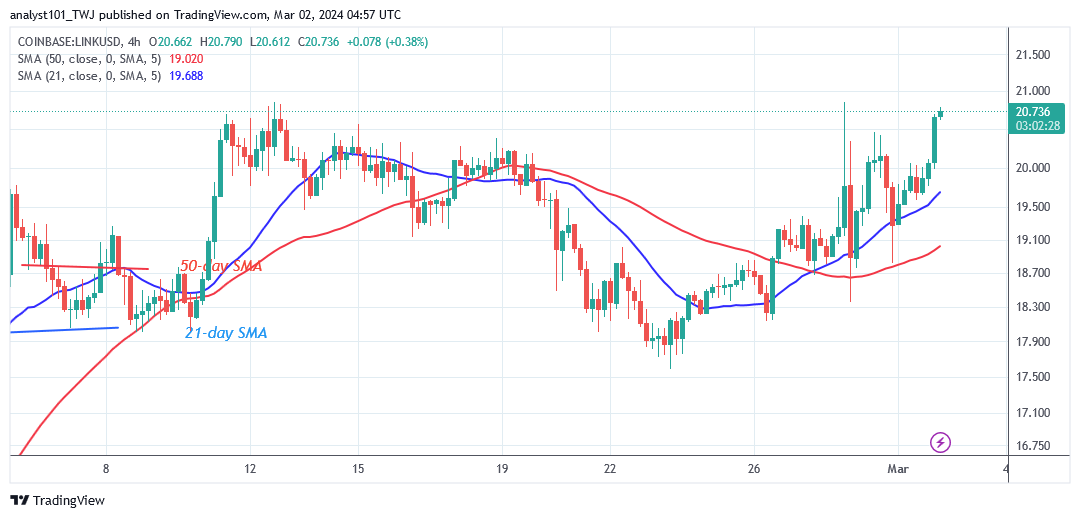
Chainlink’s (LINK) price has risen above the 21-day moving average line to resume its bullish ascent. During the initial advance, the altcoin was repelled at the $20 high. Today, the cryptocurrency price is retesting the resistance in an attempt to restart a bullish trend.
The altcoin will hit a high of $25.40 if buyers manage to break above the $20 obstacle. The altcoin will find support above the moving average lines, or roughly $20, if it is rejected at the current high. Meanwhile, the altcoin has reached a high of $21.25 as of this writing.
Technical indicators:
Major Resistance Levels – $8.00, $10.00, $12.00
Major Support Levels – $6.00, $4.00, $2.00
Chainlink (LINK) Indicator Analysis
The cryptocurrency’s price has broken above the 21-day moving average line after being caught between the moving averages. The LINK price will attempt to rise because the price bars are above the moving average lines. The horizontal moving average lines are trending up, indicating an uptrend.
What Is the Next Direction for Chainlink (LINK)?
Chainlink’s price has resumed its bullish ascent, breaking above the 21-day SMA. In the recent price action, the altcoin was forced to drift sideways after being rejected at the $20 high. Today, the resistance was broken, and the altcoin continued positive momentum. Should purchasers maintain their upward trajectory, the crypto signal is likely to remain favorable.
You can purchase Lucky Block here. Buy LBLOCK
Note: Cryptosignals.org is not a financial advisor. Do your research before investing your funds in any financial asset or presented product or event. We are not responsible for your investing result