Chainlink Falters as It Battles to Stay above $19.00
Estimated Reading Time: 2 minutes
Don’t invest unless you’re prepared to lose all the money you invest. This is a high-risk investment and you are unlikely to be protected if something goes wrong. Take 2 minutes to learn more
Chainlink (LINK) Long-Term Analysis: Bullish
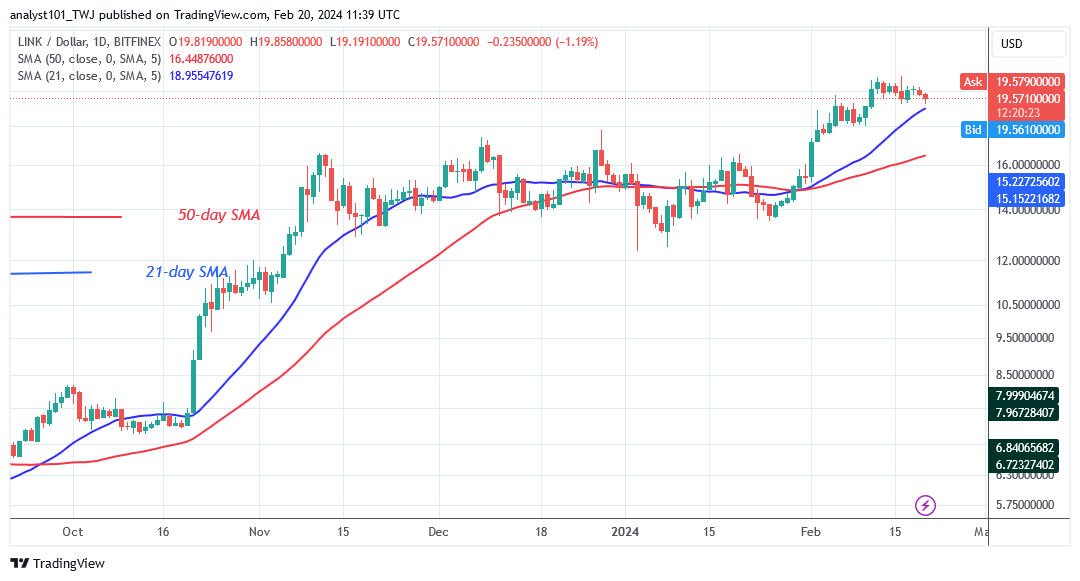
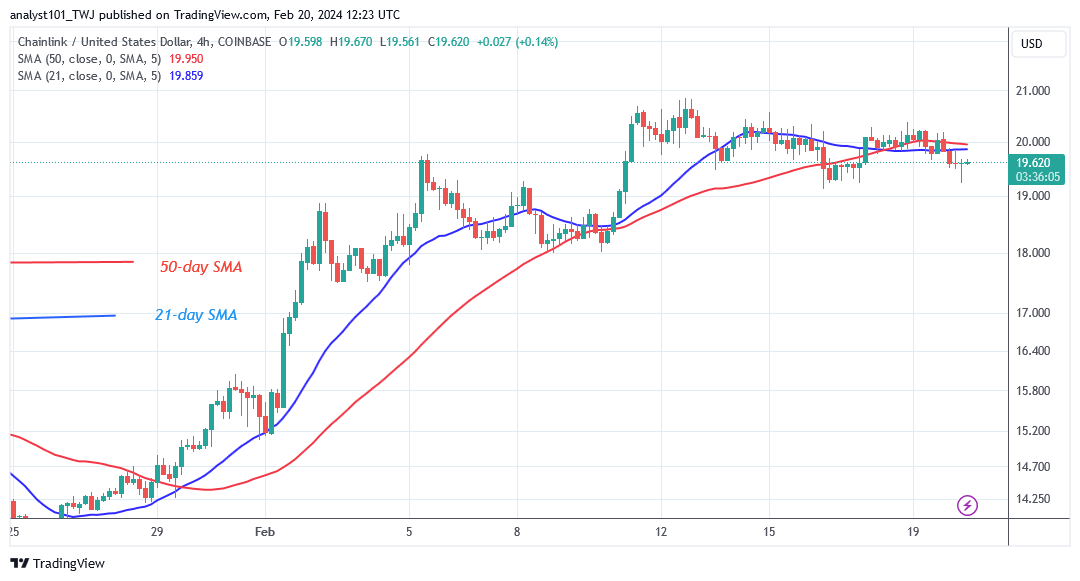
Chainlink’s (LINK) price is trading above the moving average lines as it battles to stay above $19.0.00. The current uptrend has been interrupted, as it reached a high of $20.90 on February 11, 2024. The altcoin is retracing to the moving average lines. On the downside, if the altcoin retraces and remains above the 21-day SMA or the $19 support level, the present uptrend is likely to persist.
The altcoin will rise and revisit its prior high of $21. The present rise, however, may come to a stop if the price falls below the 21-day moving average. The slide will continue to a low above the 50-day SMA or $16.00 support. Meanwhile, the altcoin continues to trade above the moving averages.
Technical indicators:
Major Resistance Levels – $8.00, $10.00, $12.00
Major Support Levels – $6.00, $4.00, $2.00
Chainlink (LINK) Indicator Analysis
Chainlink has retraced above the moving averages. The altcoin will gain if the price bars stay above the moving average lines. The moving average lines on the 4-hour chart are sloping horizontally as a result of the uptrend’s termination. On the daily chart, the moving average lines are sloping upward, indicating a previous rally.
What Is the Next Direction for Chainlink (LINK)?
Chainlink’s 4-hour chart shows a sideways trend as it battles to stay above $19.00. The dominance of the Doji candlesticks has kept the price movement motionless. The altcoin will trend once the present support and resistance levels are broken. Meanwhile, the crypto signal is fluctuating as the rally has come to an end.
You can purchase Lucky Block here. Buy LBLOCK
Note: Cryptosignals.org is not a financial advisor. Do your research before investing your funds in any financial asset or presented product or event. We are not responsible for your investing result