Chainlink Pauses Above $19 and Begins a Sideways Move
Estimated Reading Time: 2 minutes
Don’t invest unless you’re prepared to lose all the money you invest. This is a high-risk investment and you are unlikely to be protected if something goes wrong. Take 2 minutes to learn more

Chainlink (LINK) Long-Term Analysis: Bullish
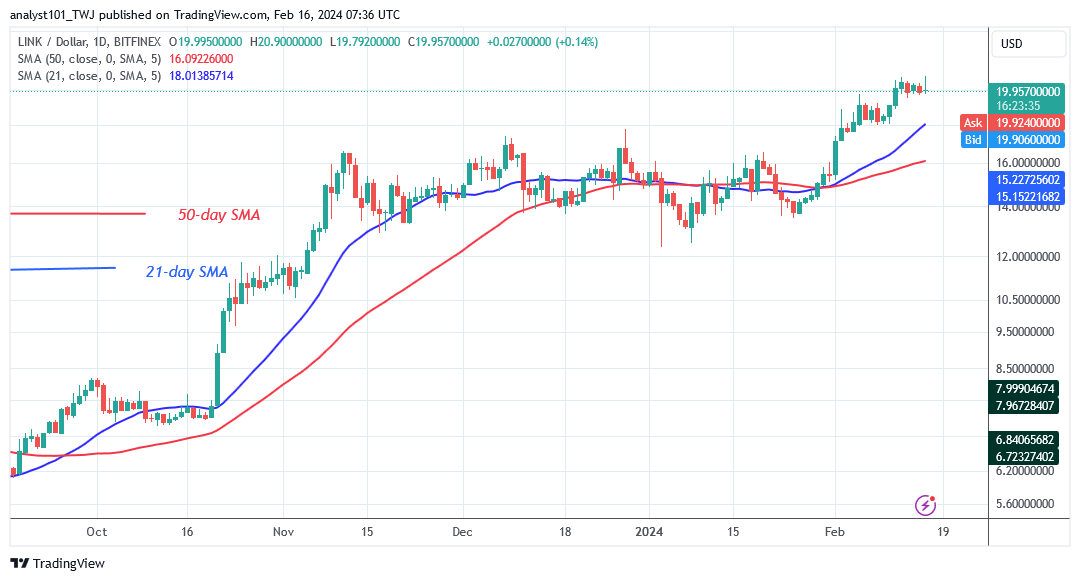
Chainlink’s (LINK) price breaks its trading range and begins a sideways move. Previously, the altcoin’s price range was $13 to $17. On February 1, the altcoin broke the previous price range, rallying to a high of $20.84. The upward trend has stalled below the $21 high. Since February 12, the advance has paused, with the crypto’s price fluctuating below the barrier level of $21.00.
The crypto currently trades between $19.50 and $21.00. The market will achieve a high of $22.42 if the current resistance is broken. Chainlink will fall if the bears break below the 21-day SMA or the $18 low. The cryptocurrency will revert to its former range-bound zone.
Technical indicators:
Major Resistance Levels – $8.00, $10.00, $12.00
Major Support Levels – $6.00, $4.00, $2.00
Chainlink (LINK) Indicator Analysis
The horizontal moving average lines are trending upward following the price rebound. The price bars are rising above the sloping moving average lines. Price movement has been modest, with Doji candlesticks dominating price action.
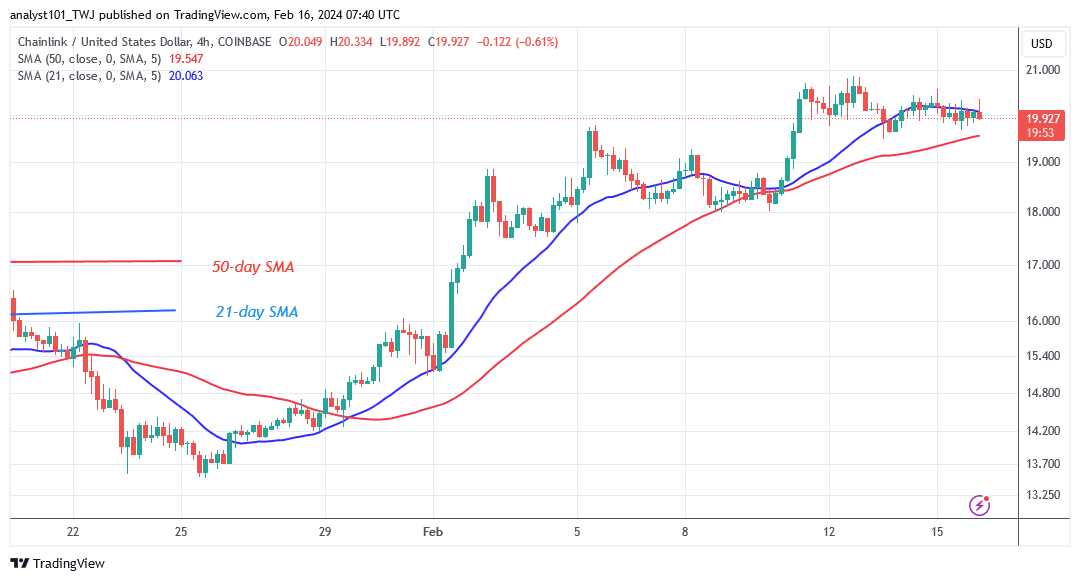
What Is the Next Direction for Chainlink (LINK)?
On the 4-hour chart, the rise has stalled as it begins a sideways move. Chainlink is currently dropping following a rejection from its previous high. The cryptocurrency signal will be negative if the price breaks below the 21-day SMA.
You can purchase Lucky Block here. Buy LBLOCK
Note: Cryptosignals.org is not a financial advisor. Do your research before investing your funds in any financial asset or presented product or event. We are not responsible for your investing result