Bitcoin (BTC/USD) Price Indices Possess a Bullish Outlook
Estimated Reading Time: 3 minutes
Don’t invest unless you’re prepared to lose all the money you invest. This is a high-risk investment and you are unlikely to be protected if something goes wrong. Take 2 minutes to learn more
Bitcoin Price Prediction – April 5
A promising negation signal has relatively obtained in the BTC/USD market to showcase the crypto-economic price indices possess a bullish outlook, following a chain of convergencies around the $27,500 line. The positivities of the market values have capped between $28,206.36 and $28,830.85 value lines at an average percentage rate of 1.13. Long-position takers should ensure they protect their positions above the point of $26,924.99 against any aggressive downtrend.
BTC/USD Market
Key Levels:
Resistance levels: $30,000, $32,000, $34,000
Support levels: $25,000, $24,000, $23,000
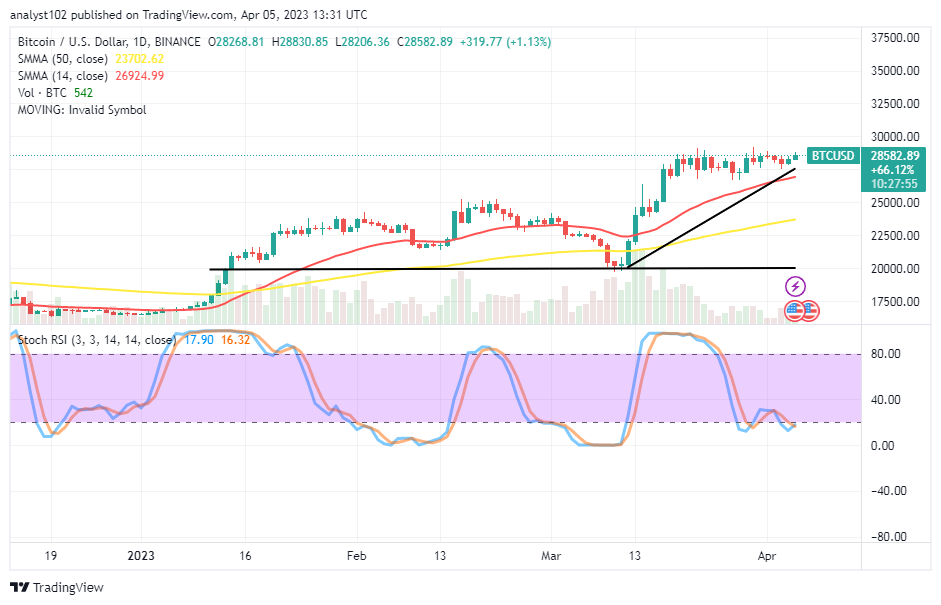
BTC/USD – Daily Chart
The BTC/USD daily chart showcases the crypto-economic market’s price indices possess a bullish outlook from the current conflicts around the $27,500 level. The 14-day SMA indicator is at $26,924.99 over the 50-day SMA indicator, which is at the $23,702.62 value line. The Stochastic Oscillators are in the area of the 20 levels, trying to cross northbound at 16.32 and 17.90. That implies the crypto business is on the verge of rising against the valuation of the US Dollar.
At this point, does the BTC/USD market has the decline trait against the 14-day SMA trend line soon?
The BTC/USD market does not tend to decline against the smaller SMA trend line soon as the crypto-economic price indices possess a bullish outlook even at a high-trading zone above the indicators. Buyers should be wary of losing momentum against the resistance levels between the $27,500 and the $26,924.99 value line of the 14-day SMA. Bulls will eventually reach marks around $32,500 if they must pursue the successive upward runs to the apex.
On the downside of the technical analysis, the BTC/USD market sellers are to regain their strength stances between the $27,500 and $30,000 values to consolidate intensively toward breaking through the lower point. However, that assumption may not play out successfully if the stochastic Oscillators don’t portend a southbound-reading condition at higher points.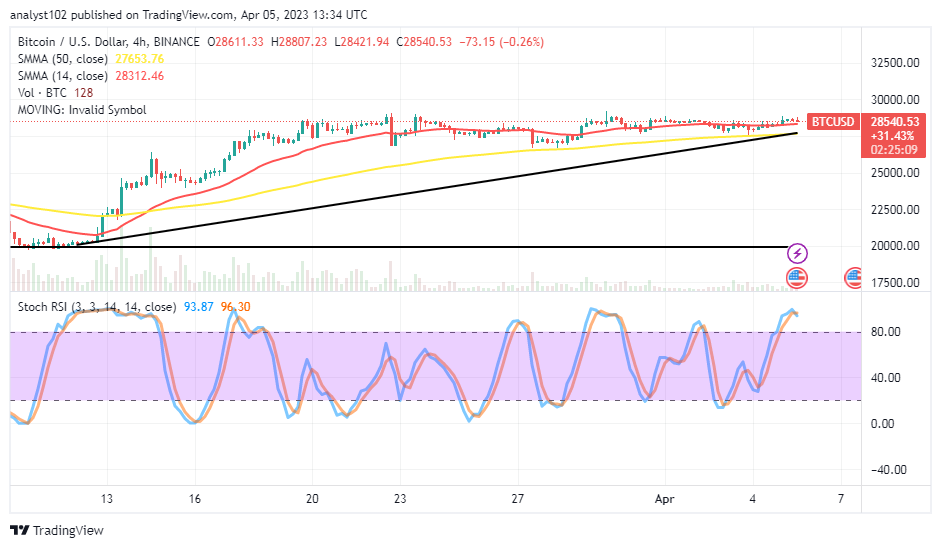
BTC/USD 4-hour Chart
The BTC/USD medium-term chart depicts the crypto-economic price indices possess a bullish outlook over the bigger SMA trend line. There have been some series of smaller-trading-bullish candlesticks. The 14-day SMA indicator is at $28,312.46 point above the $27,653.76 of the 50-day SMA indicator. The Stochastic Oscillators are in the overbought region, seemingly contemplating a cross to the downside at 96.30 and 93.87 levels. It would be ideally psychological to wait for when the Stochastics move back to a lower zone and get a repositioning posture to denote a rebound signal afterward.
Note: Cryptosignals.org is not a financial advisor. Do your research before investing your funds in any financial asset or presented product or event. We are not responsible for your investing results.
You can purchase Lucky Block here. Buy LBLOCK