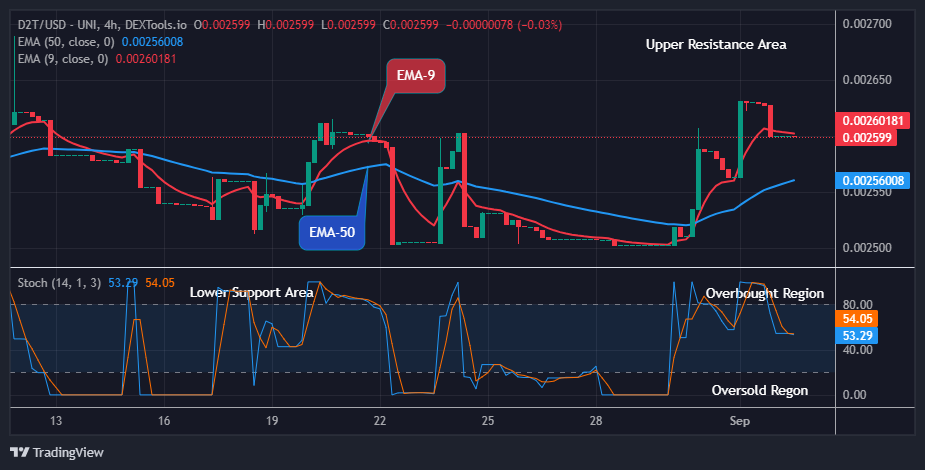
Bitcoin btc usd market keeps a deep below 17500
Estimated Reading Time: 2 minutes
Don’t invest unless you’re prepared to lose all the money you invest. This is a high-risk investment and you are unlikely to be protected if something goes wrong. Take 2 minutes to learn more
Band Protocol (BANDUSD) is trying to ward off bearish pressure
BANDUSD Analysis – The Buyers are trying to ward off bearish pressure
BANDUSD is trying hard to preserve the price increase progress it has made recently. Hence, trying to ward off bearish pressures. For a while, the coin’s market has been quiet, with the price ranging in a downward channel. Then, on the 4th of November, the price suddenly spiked to a level higher than $3.500, recording an almost 70% increase. Since then, the market has been beaten down to $1.970, but the buyers are trying to maintain their stance.
https://www.tradingview.com/x/kFbJG0Bw/
BANDUSD Key Zones
Resistance Zones: $3.050, $2.490
Support Zones: $1.970, $1.090
BANDUSD can be said to have executed a bullish reversal head-and-shoulders formation. This is highlighted by the brief cameo by the buyers and the dominance of the sellers. However, the last stroke breaks the hold and releases the coin to an upsurge, breaking the $1.970 neckline in the process. The bear immediately begins striving to pull the coin back down.
Though the market has dropped back to the $1.970 neckline, the buyers remain adamant they can keep the price up and are striving to do the same. The current daily candle had dropped to a point where the MA period 20 (Moving Average) meets with the $1.970 neckline. This will serve as an extra cushion to keep the coin above that level. The Stochastic which had been drooping into an oversold position, has rallied back towards the 50 mark.
https://www.tradingview.com/x/PcEXNr8p/
Market Expectation
On the 4-hour chart, the MA period 20 is lying above the candles. The current candle, on the other hand, is rising and attempting to trade above the MA period 20. The Stochastic Oscillator lines have crossed upward just at the border of the oversold region. This shows the buyers are holding their own in trying to keep the price up, and we can expect to see the coin stabilize above $1.970 before being tested by the bears again.