Tamadoge (TAMAUSD) Demand Level Remains Impenetrable for the Bears
Estimated Reading Time: 3 minutes
Don’t invest unless you’re prepared to lose all the money you invest. This is a high-risk investment and you are unlikely to be protected if something goes wrong. Take 2 minutes to learn more
The price action has shown indecisiveness, hovering around the $0.0100 level for a considerable period. During this time, the TAMAUSD bull market has regarded this price level as crucial support, leading to upward retracements whenever bulls respond to bearish pressure. Once again, the price rallies from this key baseline as the consolidation trend appears to approach its breaking point.
Key Levels
- Resistance: $0.035, $0.040, and $0.045
- Support: $0.010, $0.0091, and $0.0087.
TAMAUSD Price Analysis: The Indicators’ Point of View
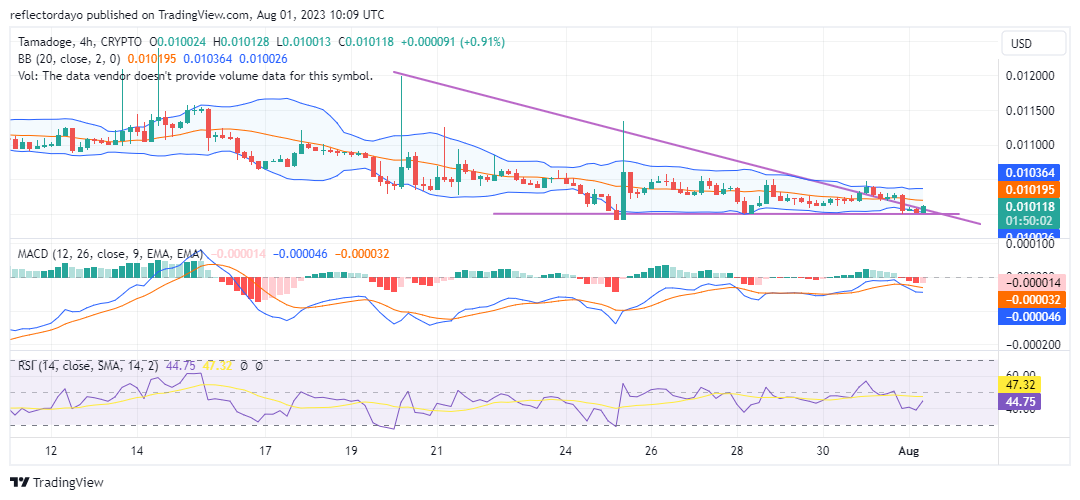
Upon observing the 4-hour chart, we identified the formation of a falling wedge price pattern in the TAMAUSD market. This pattern is known as a bullish reversal pattern, and since it develops around a key support level, it suggests a potential bullish breakout is imminent.
The series of lower highs indicates that sellers are gradually losing momentum, while the consistent lows suggest that buyers are establishing a robust support level. As the price action narrows within the wedge, it indicates a potential breakout to the upside. A bullish move may be triggered if the price breaks above the upper trendline of the falling wedge, indicating a potential trend reversal.
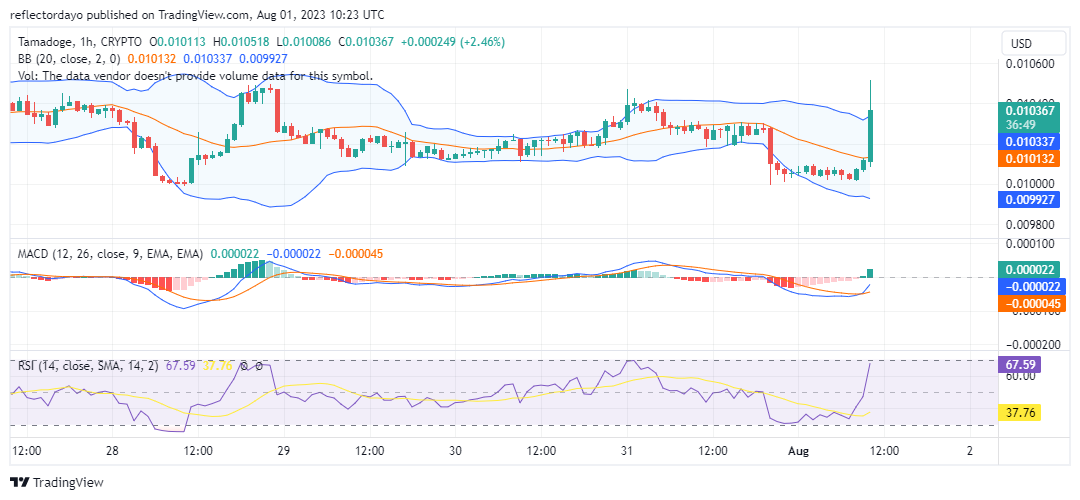
Tamadoge Short-Term Outlook: 1-Hour Chart
On the 1-hour chart, we can observe a consistent trend in the TAMAUSD market, where it remains resilient above the $0.010 price level. However, bulls are encountering difficulty breaking the resistance, which has persistently stayed below the 20-day moving average.
Nevertheless, the Moving Average Convergence and Divergence (MACD) indicator is showing a bullish crossover below the zero level. This signals a shift in favor of the bulls, indicating that the market might be initiating its upward movement.
To be the first to hear about news, giveaways, and updates, join our Telegram group!
Updates happen at lightning speed here at Tamadoge ⚡
Join our Telegram group to be first in line for news, giveaways and updates! 🤩
Chat directly with our mods and community leads, and trade gaming tips with the rest of the Tama Army 👾💪
📱:https://t.co/yPpSTpMp1p pic.twitter.com/3uz4oGaPLr
— TAMADOGE (@Tamadogecoin) July 31, 2023
Do you want a coin that will be 100 times more valuable in the next few months? That is Tamadoge. Buy TAMA today!