Litecoin (LTC/USD) Market Observes a Confluence at $80
Estimated Reading Time: 3 minutes
Don’t invest unless you’re prepared to lose all the money you invest. This is a high-risk investment and you are unlikely to be protected if something goes wrong. Take 2 minutes to learn more
Litecoin Price Prediction – December 14
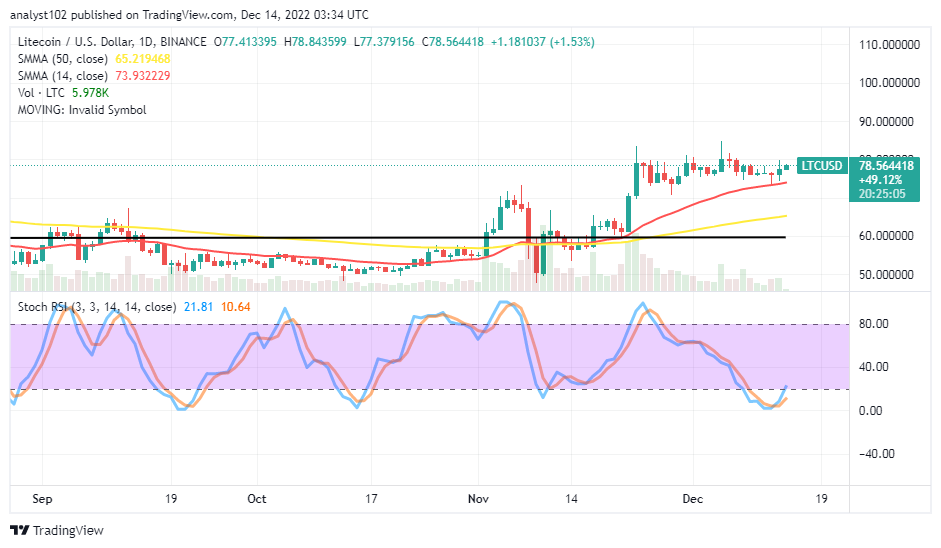
Under the settings of an inability to push over at the expense of weakness of price actions between the LTC/USD market buyers and sellers, the crypto trade is observing a confluence around the $80 line. The trading line is currently at $78.564418 and is still in the green by 1.53 percent.
LTC/USD Market
Key Levels:
Resistance levels: $85, $90, $95
Support levels: $70, $65, $60
LTC/USD – Daily Chart
The LTC/USD daily chart showcases the crypto market observing a confluence around the $80 trading spot over a couple of days above the smaller SMA trend line. The 14-day SMA indicator is at $73.932229 over the $65.219468 value line of the 50-day SMA indicator. The baseline, where the market has been pushing upward indicated by the horizontal line drawn at the $60 trading level.The Stochastic Oscillators have crossed northbound to 10.64 and 21.81 levels. That shows the price is relatively responding to some upward pressures.
What is the current position of the LTC/USD market toward a definite direction?
The LTC/USD market buyers and sellers are yet to decide which direction to push as the crypto trade observes a confluence around the $80 trading line not too far from the 14-day SMA. From the current technical point of view, buyers may have a hold of the based upon the building of energy around the smaller SMA’s value line. A loss of momentum is expected not to take place in the near time.
The reading position of the Stochastic Oscillators looks to be crucial in determining the next sales-off trading moment, according to the bearish technical analysis. Alternatively, short-position placers may have to be patient until the price pulls up in a way to test a higher-resistance trading point over its current convergence spots for a correction before starting to launch shorting orders afterward.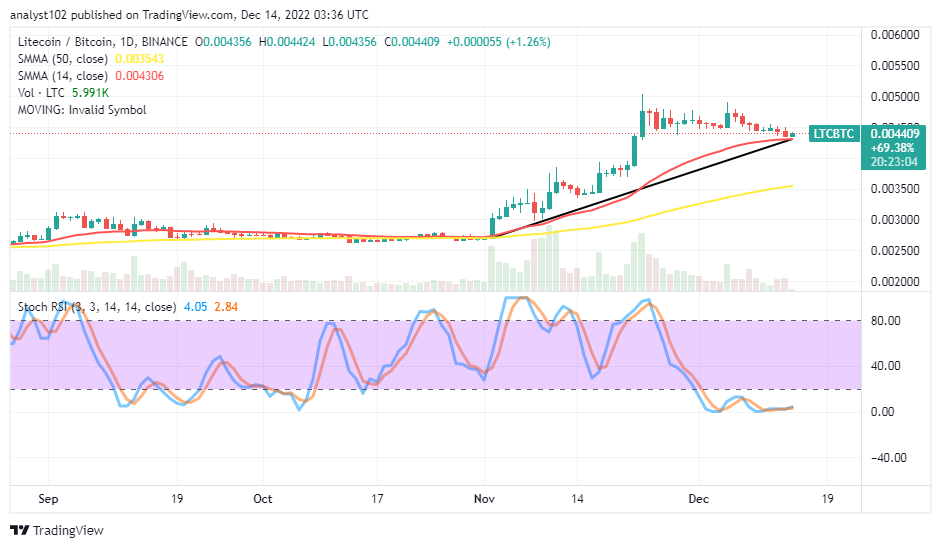
LTC/BTC Price Analysis
In comparison, Litecoin maintains a bullish-trending outlook against Bitcoin’s trending capacity as price observes a confluence near the trend line of the smaller SMA. The 14-day SMA indicator is above the 50-day SMA indicator. The Stochastic Oscillators have moved southbound into the oversold region, trying to consolidate within it at a pace of 2.84 and 4.05 levels. That implies the base crypto is somewhat waxing energy, pairing with the pushing ability of the counter-trading crypto.
Note: Cryptosignals.org is not a financial advisor. Do your research before investing your funds in any financial asset or presented product or event. We are not responsible for your investing results.
You can purchase Lucky Block here. Buy LBLOCK