Uniswap (UNI/USD) Price Pushes Closer to $30 Level
Estimated Reading Time: 3 minutes
Don’t invest unless you’re prepared to lose all the money you invest. This is a high-risk investment and you are unlikely to be protected if something goes wrong. Take 2 minutes to learn more
Uniswap Price Prediction – October 21
The UNI/USD price activity now pushes closer to the $30 trading level. It appears that the crypto-economic market is not actively moving in a definite direction as it trades around $27, keeping a percentage rate of about 0.86.
UNI/USD Market
Key Levels:
Resistance levels: $30, $33, $36
Support levels: $25, $23, $21
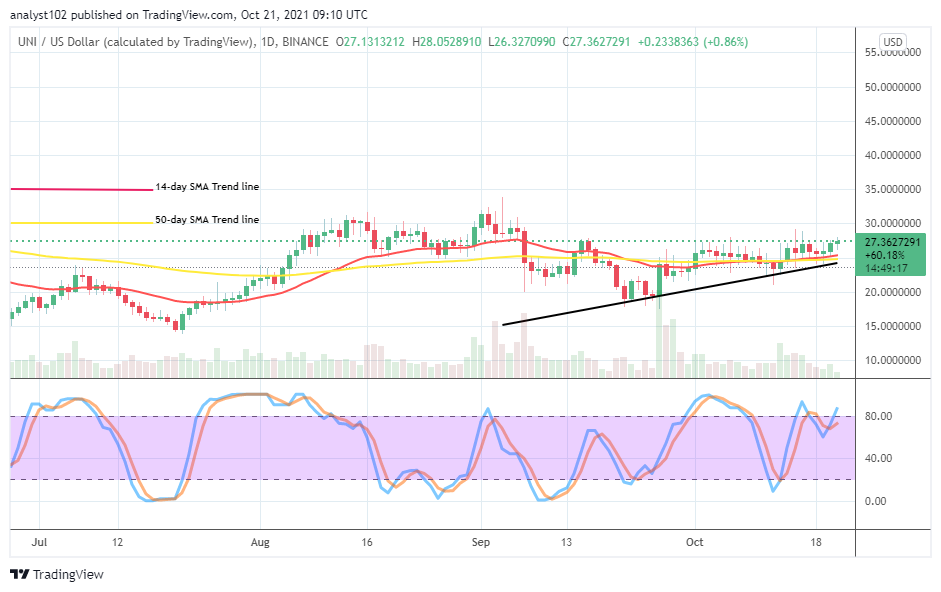
UNI/USD – Daily Chart
The UNI/USD daily chart reveals that the UNI/USD price pushes closer to $30 as there have some smaller bullish candlesticks above the conjoined spot line of the SMAs. There has been a relatively bullish outlook in the market. But, it is also not far from a ranging formation. The 14-day SMA trend line and the 50-day SMA trend line have joined together at around $25 level. The Stochastic Oscillators have briefly crossed the lines northbound against the range line at 80. That indicates that some buying pressures may dominate the market.
How long will the UNI/USD market feature beneath the $30 level as price pushes closer to it?
The featuring of UNI/USD market operation would depend on what the two major market movers put up with in terms of their reactions as price pushes closer to $30. Bulls needed to intensify efforts in building more energies as there has been a bullish candlestick emergence presently in the crypto-economic operations. The market level at $25 yet serves as the point that some upward stances will be getting decent long entry positions.
On the downside, the UNI/USD market bears are to be on the lookout for an active price reversal motion against a higher trading zone before considering a sell order. A breakout would have to occur against the $30 resistance level, bagging a quick reversal against a presumed scenario to warrant the sell entry.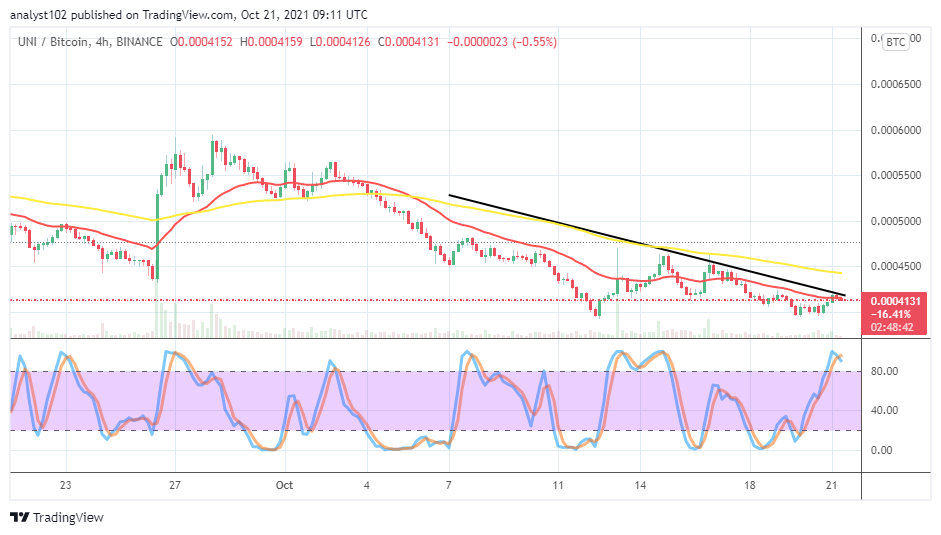
UNI/BTC Price Analysis
In comparison, Uniswap’s trending ability with Bitcoin is underweighted as price pushes closer around the smaller SMA. The 50-day SMA indicator is above the 14-day SMA indicator. The bearish trend line drew over the indicators to showcase the bearish path that the duo cryptos keep. The Stochastic Oscillators have moved into the overbought region, attempting to cross the lines southbound. That signifies that the base crypto may still lose momentum for a while as trade against the flagship counter trading instrument.
Note: Cryptosignals.org is not a financial advisor. Do your research before investing your funds in any financial asset or presented product or event. We are not responsible for your investing results.
You can purchase crypto coins here. Buy Tokens