Tamadoge (TAMAUSD) Prepares for a Bounce
Estimated Reading Time: 2 minutes
Don’t invest unless you’re prepared to lose all the money you invest. This is a high-risk investment and you are unlikely to be protected if something goes wrong. Take 2 minutes to learn more
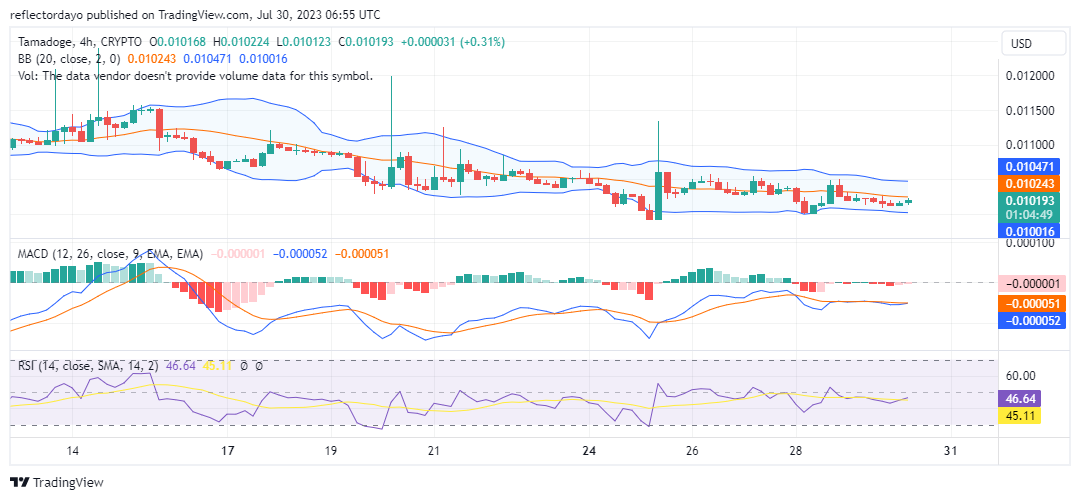
Despite the Tamadoge pair persisting within a narrow horizontal price range, it has successfully remained above a crucial demand level. Currently, the market sees equal responsiveness from both bears and bulls, contributing to the consolidation within this range.
Key Levels
- Resistance: $0.035, $0.040, and $0.045
- Support: $0.010, $0.0091, and $0.0087.
TAMAUSD Price Analysis: The Indicators’ Point of View
The Tamadoge pair is currently positioned slightly above the critical support level, indicating notable progress from the bulls within the price range. Additionally, in the Moving Average Convergence and Divergence (MACD) indicator, both lines are observed moving in tandem below the zero level, with the fast line crossing over the slow line. This development serves as a positive signal for bullish sentiment.
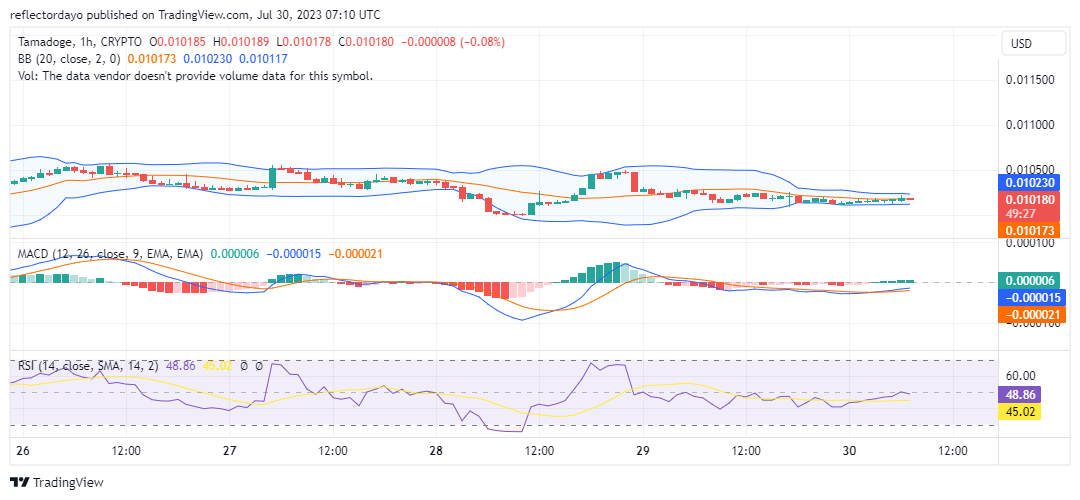
Tamadoge Short-Term Outlook: 1-Hour Chart
Analyzing the current market perspective, we observe the Bollinger Bands indicator displaying a narrower price channel, indicating an intensifying tug-of-war between demand and supply. This suggests an imminent price breakout. Moreover, the Relative Strength Index (RSI) shows the market is currently moving toward equilibrium. As a result, the stage is set for potential bullish actions in the near future.
Check out the newest Tamadoge games and NFTs.
🗞️ ICYMI: Last week’s Weekly Tamadoge Update 🗞️
Community Manager, Tama Tom, dished out all the updates about our newest games, NFTs and more!
Catch up now ▶️ pic.twitter.com/B2xKbFU5Oy
— TAMADOGE (@Tamadogecoin) July 29, 2023
Do you want a coin that will be 100 times more valuable in the next few months? That is Tamadoge. Buy TAMA today!