BNB (BNB/USDT) Experiences Increased Volatility with a Recent Downturn
Estimated Reading Time: 3 minutes
Don’t invest unless you’re prepared to lose all the money you invest. This is a high-risk investment and you are unlikely to be protected if something goes wrong. Take 2 minutes to learn more
Over the previous 24 hours, the market for BNB against Tether has recorded a minor gain of around 1.46%, a figure considered bigger than the broader crypto market gain of 0.86%. It was also observed that last week, technical rebound from the oversold region, strong institutional demand, and network upgrade are part of the factors contributing to the growth as the pair prepares for a potential upside move.
As it stands, the immediate price action suggests the pair is preparing for a rebound, with the Stochastic RSI indicating a move into the neutral zone while the Bollinger Bands are still heading towards the south-east course on the daily timeframe.
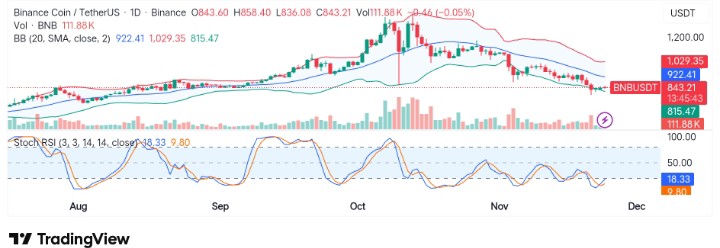
Currently, BNB trades at $843.21 with more than 111 thousand traded volumes at the beginning of the week.
Technical Indicators
Major Resistance Levels: $850.00, $922.41, and $1,029.35
Major Support Levels: $835.74, $815.47, and $750.00
Technical Analysis
On the daily chart, the cloud of bearish sentiment still lingers on BNB against Tether as seen with the reaction of the price below the 20-period moving average. However, the contraction of the bands suggests the market is currently consolidating, as the previous day’s price action reacted positively to the lower band.
From another angle, the Stochastic RSI is in the oversold region, suggesting the potential for a bounce, but the current resistance around $850 needs to be broken to confirm a move into the $1,000 zone. To this end, the pair needs more bullish participation beyond the last 48 hours to sustain this move; otherwise, a break below $820-$815 may materialize.
$BNB closed the week with a strong bounce over the key $800 range.
Squeezing against the main downtrend resistance. Consolidation over $900 would trigger the reversal 👀
📍 More trade set ups at: https://t.co/N3WuQcXu9U pic.twitter.com/ontFhz3Ph9
— Rand (@cryptorand) November 24, 2025
Meanwhile, @CryptoRand has reported that BNB closed the previous week with a strong bounce above $800. The analyst notices a squeeze around this level, pointing out that a crossover above $900 would go a long way in determining the stability of an uptrend.
BNB/USDT Analysis: A Rebound or Compression?
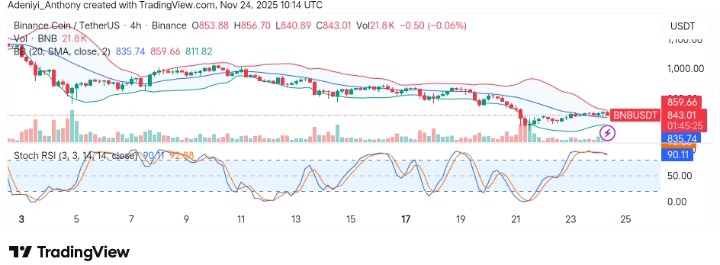
On the 4-hour chart, BNB/USDT seems to be showing a temporary rebound after a slight low, with the price currently holding below the upper band, suggesting an impending low may be forming. Meanwhile, the momentum oscillator now operates in the extreme overbought zone, signaling the possibility of a brief low before any upside movement.
As it stands, the price appears to be stabilizing around $843.01. A push towards the $850 zone can only be possible if the bullish momentum continues.
You can purchase crypto coins here. Buy Crypto