BNB (BNB/USDT) Shows Signs of Bearish Consolidation Below Key Resistance
Estimated Reading Time: 3 minutes
Don’t invest unless you’re prepared to lose all the money you invest. This is a high-risk investment and you are unlikely to be protected if something goes wrong. Take 2 minutes to learn more
The market for BNB against Tether over the last 24 hours has extended slightly to the south; the coin has experienced a 6.3% decline in the last seven days. As it stands, the pair seems to be facing significant selling pressure amid a technical breakout and the demand for larger market capitalization.
Recently, BNB appears to be seeing improvement to the north after operating around $920, as the Bollinger Bands and Stochastic RSI suggest there might be an impending move to the north.
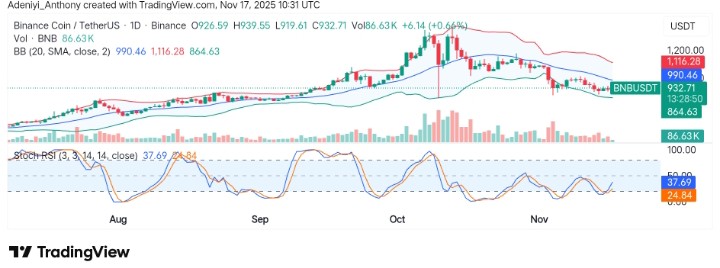
Currently, BNB trades at $932.71, recording 0.91% gains in the recent session.
Technical Indicators
Major Resistance Levels: $945, $1,100, and $1,200
Major Support Levels: $915, $900, and $864
Technical Analysis
On the daily timeframe, BNB against Tether is consolidating, moving on a straight line. However, the price appears to have found good support at the current level, as the Bollinger Bands seem to be expanding. This indicates that with the participation of more bullish traders, a move above the dynamic line may be seen soon.
From another angle, the Stochastic RSI beneath the chart shows that in the previous session, the pair has lost a lot of momentum due to increased sell pressure, but it appears the lines are moving to the north from the oversold region, suggesting an upside move might be seen soon.
To this end, it appears the Stochastic RSI points to an improvement to the north, but, considering the curvature of the bands to the south, a move above $990 or below $915 will determine the next direction.
#BNB AT A BIG DECISION POINT.$BNB can move above the $989.9 level, do you think it can push back toward its $1,370 all time high? pic.twitter.com/y7JzKZMt0a
— Zia ul Haque (@ImZiaulHaque) November 15, 2025
Meanwhile, @ImZiaulHaque is feeling rather skeptical about the current BNB price action. However, the analyst suggests a move above $1,000 may be the next direction.
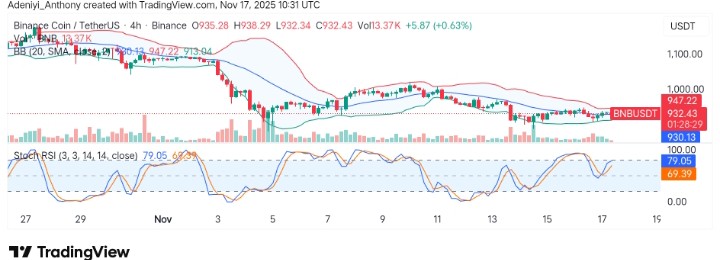
BNB/USDT Analysis: Are the Bulls Gaining Control?
On the 4-hour chart, BNB/USDT appears to be facing exhausted bullish momentum; the price seems to be operating above the 20-period dynamic line within a contracting band and an overbought momentum oscillator. This suggests the tide is about to change as immediate resistance appears around $945.
To this end, BNB may experience another round of bearish waves, as the indicators on the chart point to an impending downward move.
You can purchase crypto coins here. Buy Crypto