Uniswap (UNI) Price Prediction: UNI/USDT Dives
Estimated Reading Time: 2 minutes
Don’t invest unless you’re prepared to lose all the money you invest. This is a high-risk investment and you are unlikely to be protected if something goes wrong. Take 2 minutes to learn more

Date: September 25, 2025
The long-term upward retracement in the Uniswap daily market has failed. This can be seen as price action broke through the floor of the upside-sloping price channel. As of now, downward forces are still in control and maintaining pressure.
UNI/USDT Long-Term Trend — Bullish (Daily Chart)
Key Price Levels
Resistance: $8.00, $9.00, $10.00
Support: $7.00, $6.00, $5.00
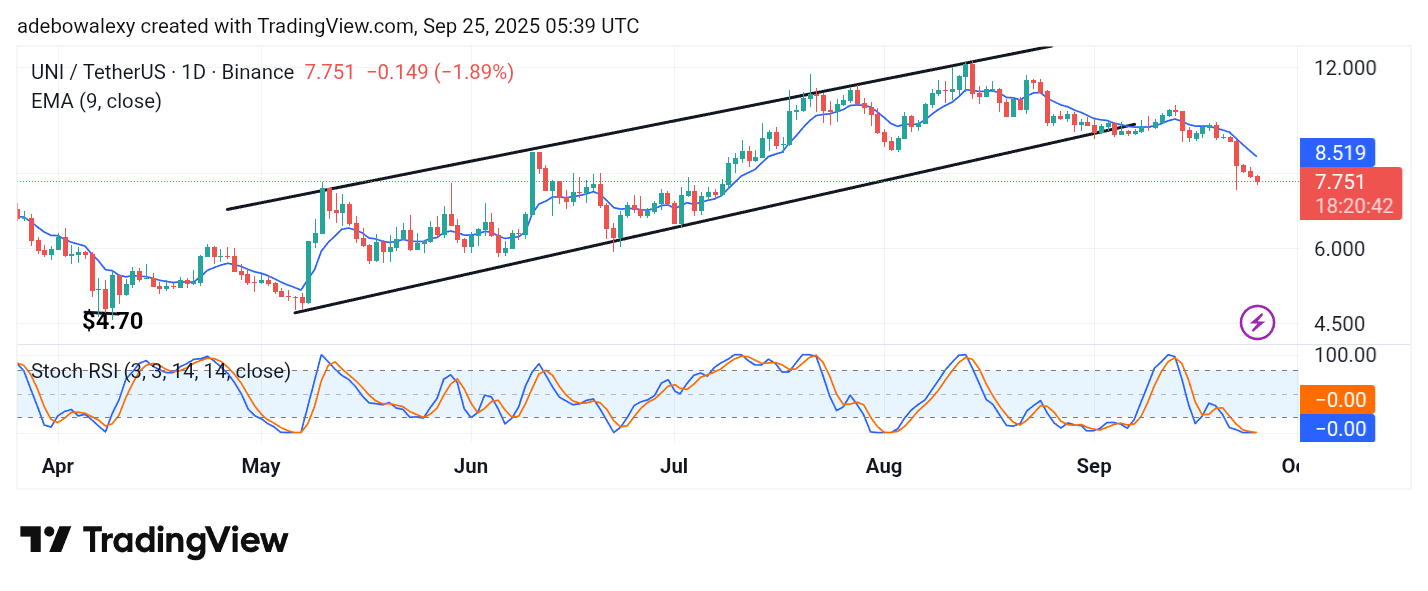
Price activity in the Uniswap daily market has continued to slide downward after falling below the floor of the drawn price channel. Price action has now refrained from testing the resistance at the 9-day Exponential Moving Average (EMA) line. At the same time, the Stochastic Relative Strength Index (SRSI) indicator lines are flat out in the oversold region, with the indicator lines merged and dragging sideways there.
Uniswap Price Prediction: UNI/USDT Heads South
With Uniswap price action falling below the 9-day EMA curve, recent sessions have been represented by moderate-sized price candles. However, this price candle has a steep bearish trajectory below the 9-day EMA curve.
Technically, this indicates clear bearish sentiment in the market. Likewise, the movement of the SRSI indicator lines can be seen merged and dragging sideways in the oversold region. Technically, this further drives home the impression that price action may proceed lower subsequently.
Uniswap Price Prediction: UNI/USDT Bears Continue to Prevail (4-Hour Chart)
Even on the shorter time frame of the Uniswap market, it is clear that price action is set to keep going south. The last price candle here is a red one, appearing below the 9-day EMA curve. However, a careful examination of the last price candle on this 4-hour chart reveals an upward contraction.
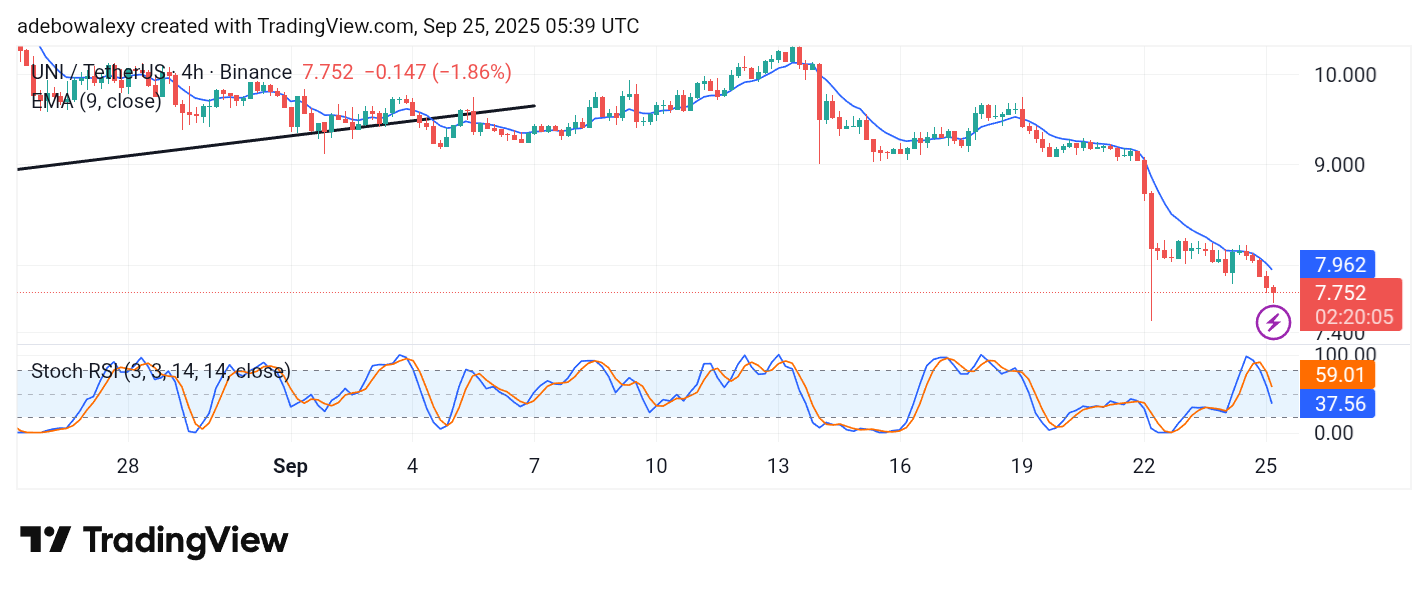
Meanwhile, the SRSI indicator lines can also be seen falling steeply into the oversold region at this time. As a result, this suggests that bullish attempts in this market may still be overwhelmed, and as such, price activity may proceed lower toward $7.50 and possibly $7.00.