Uniswap (UNI) Price Prediction: UNI/USDT Sees Modest Recovery
Estimated Reading Time: 2 minutes
Don’t invest unless you’re prepared to lose all the money you invest. This is a high-risk investment and you are unlikely to be protected if something goes wrong. Take 2 minutes to learn more

Date: September 18, 2025
The Uniswap market came under pressure after its price action last hit the ceiling of the upside-sloping price channel on the token’s daily chart. The rebound off this limit was sufficient to crack the market through the floor of the price channel.
UNI/USDT Long-Term Trend — Bullish (Daily Chart)
Key Price Levels
Resistance: $10.00, $11.00, $12.00
Support: $9.00, $8.00, $7.00
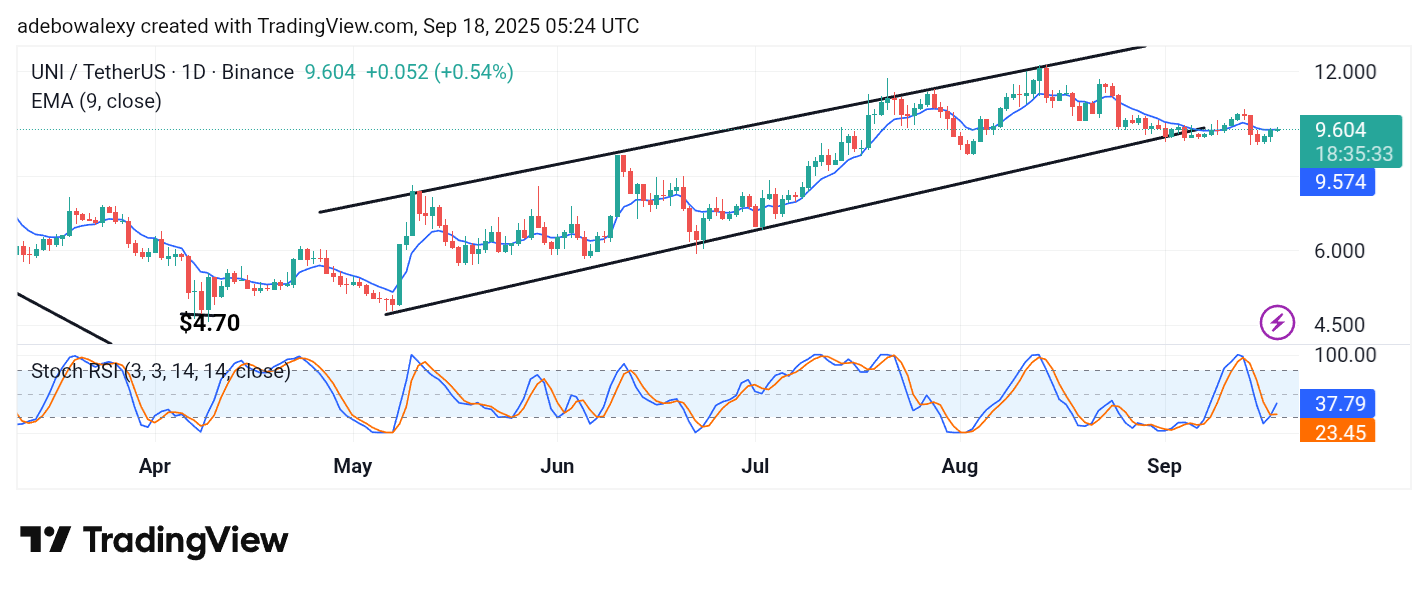
On the Uniswap daily price chart, price action has seen some recovery compared to what was previously observed. Also, the ongoing session has appeared as a green price candle and stands above the 9-day Exponential Moving Average (EMA) curve. Likewise, the Stochastic Relative Strength Index (SRSI) indicator has performed an upward crossover in the oversold region of the indicator.
Uniswap Price Prediction: UNI/USDT May See More Recovery
The Uniswap daily chart shows that price activity has rebounded upward after testing the support level at $9.10. The ongoing session has appeared as a small price candle but still above the 9-day EMA curve.
This suggests that more upward movement may be seen in this market from here on out. The SRSI indicator line has delivered an upward crossover, coinciding with the fact that upside forces are likely to maintain control. This will give rise to a continued upward retracement in this market.
Uniswap Price Prediction: UNI/USDT Upside Progress Seems Rejected (4-Hour Chart)
The ongoing session in the Uniswap 4-hour market shows that bears are leading. This is a shorter time frame and therefore provides a more microscopic view of the market than the daily chart.
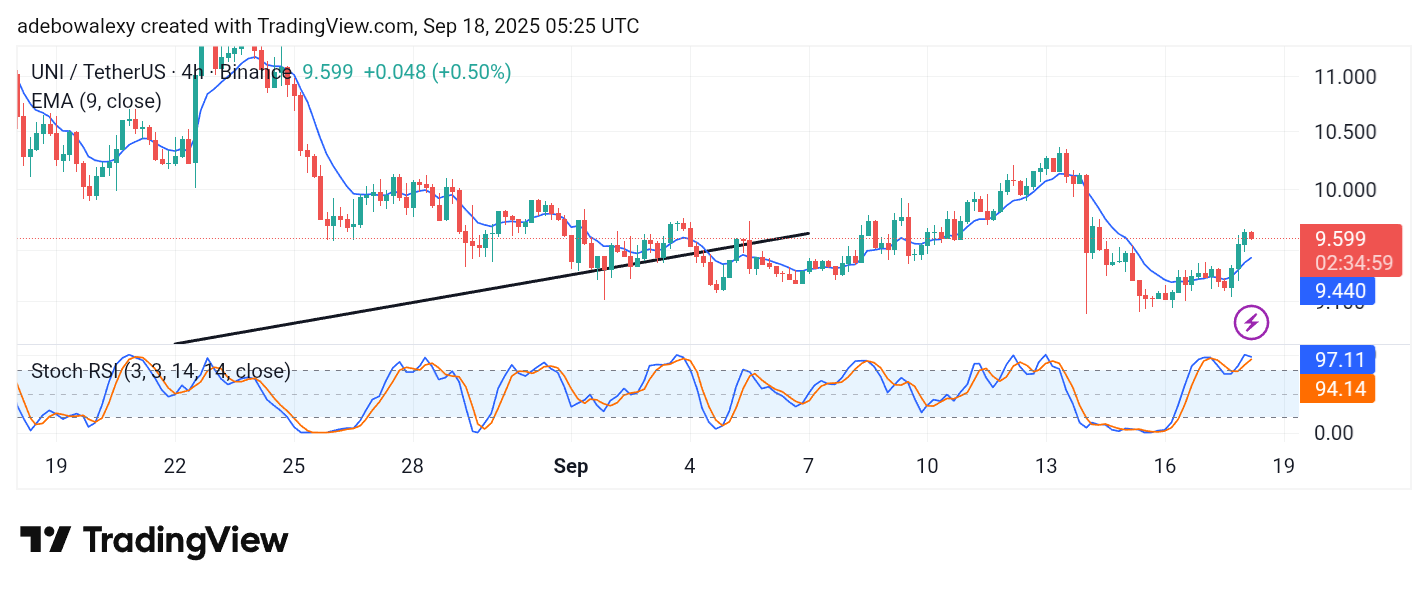
Nevertheless, trading continues above the EMA curve and at a considerable distance from it. Meanwhile, the SRSI indicator lines are positioned in the overbought region of the indicator. At the same time, the lead line of the indicator is deflecting toward a crossover. Technically, this signals a possible pullback before an eventual upside continuation toward the $11.50 price mark.