Bitcoin (BTC/USD) Market Volatility Surges Against $27,500
Estimated Reading Time: 3 minutes
Don’t invest unless you’re prepared to lose all the money you invest. This is a high-risk investment and you are unlikely to be protected if something goes wrong. Take 2 minutes to learn more
Bitcoin Price Prediction – March 29
There has been a lowering of pressures at a high trading spot as the BTC/USD market volatility surges against the $27,500 psychological line. From a low point of $27,298.77, the increasing crypto-economic valuation has risen to a current price of roughly $28,508.00, maintaining a positive percentage rate of 4.42. The present uprising could mean a decimation sign to the production of the possibility of declines in resumption in the near time.
BTC/USD Market
Key Levels:
Resistance levels: $30,000, $32,000, $34,000
Support levels: $25,000, $24,000, $23,000
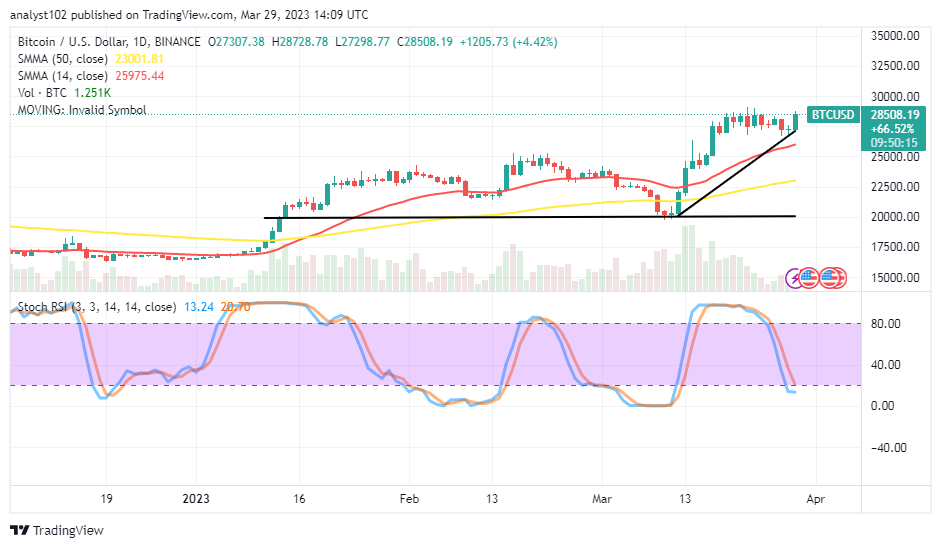
BTC/USD – Daily Chart
The BTC/USD daily chart reveals that the crypto-economic market volatility surges against the $27,500 crucial trading zone after a confluence characterized by a range of smaller bearish candlesticks over the buy signal side of the smaller SMA. The 14-day SMA indicator has trended to $25,975.44 above the 50-day SMA indicator, which is at $23,001.81. The Stochastic Oscillators are down near the oversold region to keep 20.70 and 13.24 levels. With the formation of a bullish candlestick beefing presently, it appears bears will not hold a reliable stance.
Could the BTC/USD market’s activity eventually slow down compared to its 14-day SMA’s current point?
An aggressive breakdown of the BTC/USD market against its smaller SMA’s current value line will likely lead back the moves into a devaluation-moving course as it observed that the crypto’s price volatility surges against the $27,500 axis. That value line should serve as the pivotal point where long-position placers shouldn’t comprise their energy-beefing mode at no other term basis. Instead, the trading value line might be a place to reenergize to make an upward swing.
The BTC/USD market bears appear to gradually lose their reclaiming stances on the descending side of the technical analysis of BTC/USD as the trading cycle has been moving upward. As it is, sellers will have to wait for another round of what will portend as an overbought condition in an extreme signal mode before considering launching back the shorting order positions.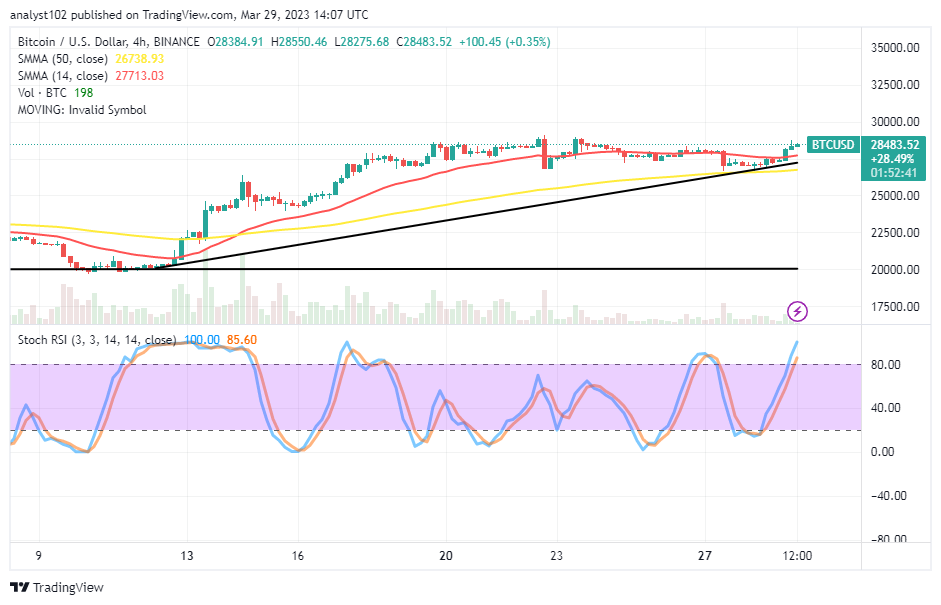
BTC/USD 4-hour Chart
The BTC/USD medium-term chart shows that the crypto market volatility surges against the $27,500, following the price’s inability to debase further during a decline in the 27th session. The 14-day SMA indicator is at $27,713.03 over the $26,738.93 value line of the 50-day SMA indicator. The Stochastic Oscillators have penetrated the overbought region at 85.60 and 100 levels. And they are pointing toward the north to indicate that a buying force is ongoing. However, there is a need to be wary of joining the trend abruptly to avoid being whipsawed unnecessarily.
Note: Cryptosignals.org is not a financial advisor. Do your research before investing your funds in any financial asset or presented product or event. We are not responsible for your investing results.
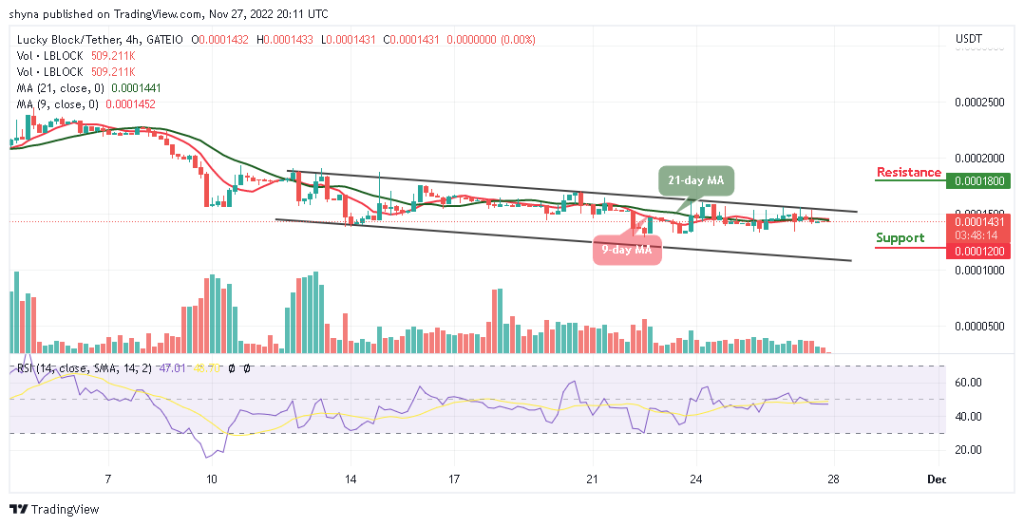
You can purchase Lucky Block here. Buy LBLOCK