Bitcoin (BTC/USD) Price Engages in Bullish Consolidation Manner
Estimated Reading Time: 3 minutes
Don’t invest unless you’re prepared to lose all the money you invest. This is a high-risk investment and you are unlikely to be protected if something goes wrong. Take 2 minutes to learn more
Bitcoin Price Prediction – March 22
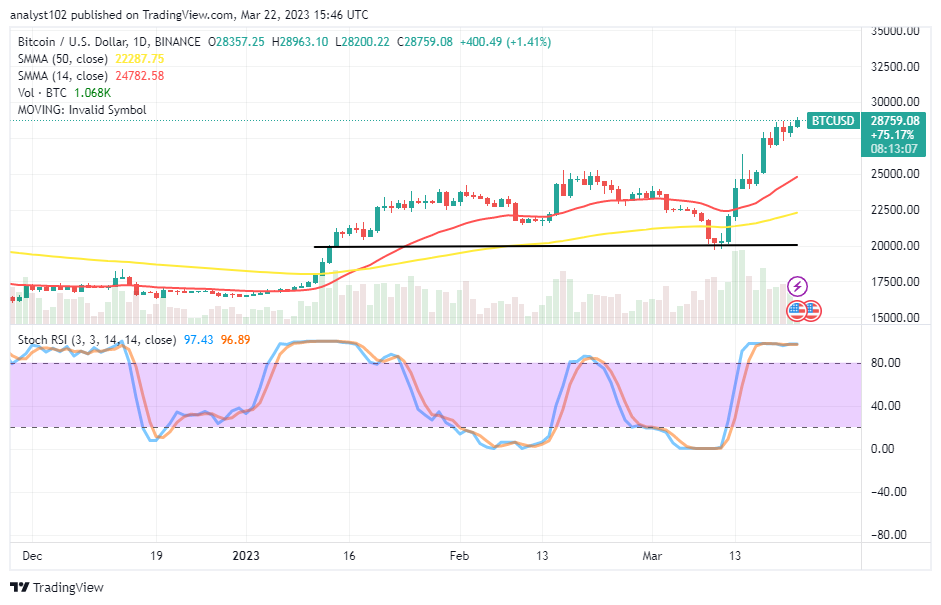
It has been that the BTC/USD market has engaged in bullish consolidation mode, featuring within the trading zones of $28,963.10 and $28,200.22 value points at an average rate of 1.41 percent as when this technical analytics has been. The $24,782.58 level of the 14-day SMA indicator is above the $22,287.75 value lines. Below the trade candlesticks, they are heading toward the north. The Stochastic Oscillators are in the overbought area and are firmly clogged at 96.89 and 97.43 levels, indicating that an upward force is still present.
BTC/USD Market
Key Levels:
Resistance levels: $30,000, $32,000, $34,000
Support levels: $26,000, $24,000, $22,000
BTC/USD – Daily Chart
The BTC/USD daily chart showcases that the crypto-economic price has engaged in bullish consolidation since around March 16th session during the time of another stage of an overbought condition recently. The 14-day SMA indicator is at $24,782.58 above the $22,287.75 value lines. And they are pointing toward the north direction below the trading candlesticks. The Stochastic Oscillators are in the overbought region, clogging their tightly at 96.89 and 97.43 levels to indicate that a force to the upside is ongoing.
When can the BTC/USD market activities experience a depletion of rises?
A test of the $30,000 resistance level in the procedure of the current upward forces in the BTC/USD trade is likely to give birth to a pause that can in no time cause a significant reversal-moving manner as the price engages in a bullish consolidation. The current condition has created an insight that the market has begun gradually to surge back into a bullish cycle, especially if an oversold outlook is detected on the Stochastic Oscillators in the long run afterward.
On the reduction side of the BTC/USD technical analysis report, the BTC/USD market bears may have to wait for what could be the aftermath reactions of the price around the $30,000 resistance before placing a position for a shorting purpose. However, if the market tends to form a bearish candlestick, engulfing some of the penultimate between the 18th and the 21st trading days, the subsequent operations will potentially succumb to more lows.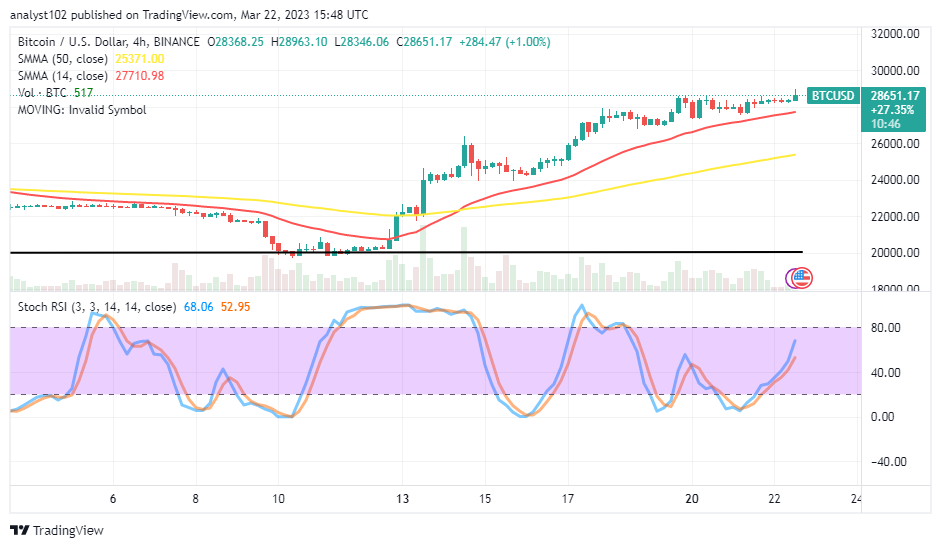
BTC/USD 4-hour Chart
The BTC/USD medium-term chart showcases a series of smaller bullish-4-hour candlesticks, characterizing the crypto price engaging in bullish consolidation over the trend line of the smaller SMA. The 50-day SMA indication is at $25,371.00, beneath the 14-day SMA indicator is at $27,710.98. The Stochastic Oscillators are in a state of northbound-swerving manner from the oversold region to 52.95 and 68.06 levels. The breaking of the smaller SMA to the negative side will signify the moment that bulls begin to lose their catalyst.
Note: Cryptosignals.org is not a financial advisor. Do your research before investing your funds in any financial asset or presented product or event. We are not responsible for your investing results.
You can purchase Lucky Block here. Buy LBLOCK