Bitcoin (BTC/USD) Market Has Spiked to $26,000
Estimated Reading Time: 3 minutes
Don’t invest unless you’re prepared to lose all the money you invest. This is a high-risk investment and you are unlikely to be protected if something goes wrong. Take 2 minutes to learn more
Bitcoin Price Prediction – March 15
During yesterday’s trading session, the BTC/USD market spiked to a resistance line of around the $26,000 point shortly before it started to witness a reversal motion. The present trading situation’s percentage rate is at a minute of 0.12 negative as the price is trading between $25,066.88 and $24,296.29 spots. Buyers appear unable to keep upsurges farther over the value under the current northward force settings.
BTC/USD Market
Key Levels:
Resistance levels: $26,000, $27,000, $28,000
Support levels: $21,000, $20,000, $19,000
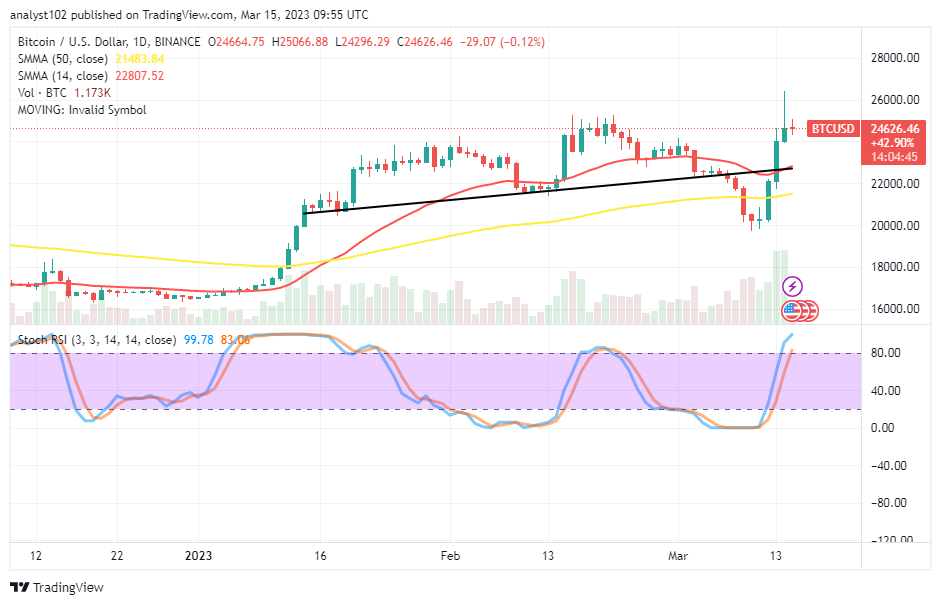
BTC/USD – Daily Chart
The BTC/USD daily chart reveals the crypto market has spiked to the $26,000 resistance trading level in the recent operations offside the buy signal side of the SMAs. The 14-day SMA indicator has briefly curved northward at $22,807.52 above the $21,483.84 value line of the 50-day SMA indicator. The trade’s systemic points of the upward trajectory have been on the bullish trend line drawn. The Stochastic Oscillators are in the overbought region at 83.06 and 99.78 levels.
What strategic support levels are necessary for the BTC/USD market to maintain against the current surging cycle?
The necessary support levels that the BTC/USD trade has to keep against the present surging cycle have to be between $22,500 and $20,000 as the crypto market has spiked initially to the resistance of $26,000. Some active northward-moving pressures are liable to surface over the trend lines of the SMAs. And such moves can also lead to losing stances in a falling mode in no time. Therefore, the execution of longing order around the resistances stated above lacks the potency of withstanding the test of time.
On the falling side of the BTC/USD technical analysis report, as there has been a significant rise to have observed a systemic resistance path a bit higher to the previous points of around $23,000 and $25,000, short-position takers need to look out for momentum loss on the part of bulls at a higher resistance level of $26,000.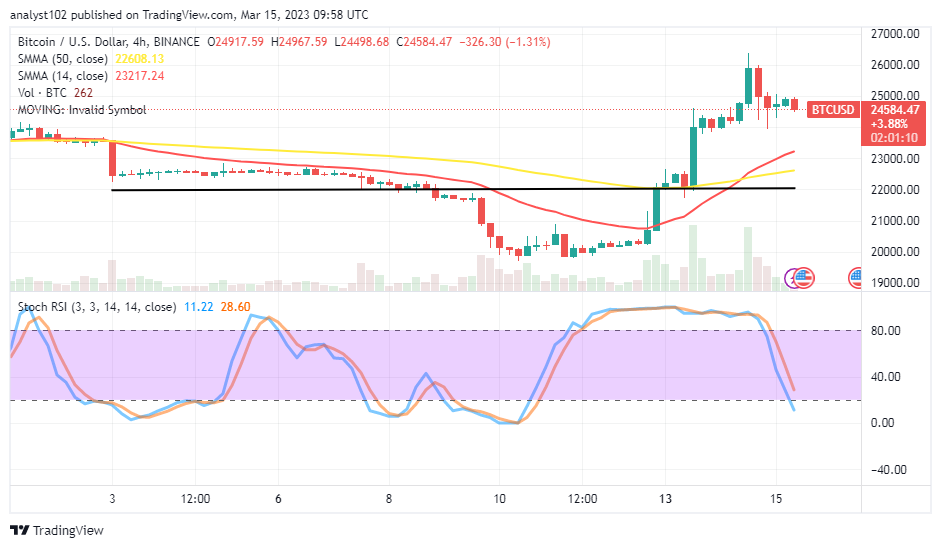
BTC/USD 4-hour Chart
The BTC/USD medium-term chart showcases the crypto market has spiked to hit resistance around the $26,000 level. The 5th trading 4-hour candlestick occurred to signify the beginning bearish journey from around the value line. The 14-day SMA indicator is $23,217.24 above the $22,608.13 point of the 50-day SMA indicator. The Stochastic Oscillators have turned southbound from the overbought region to 28.60 and 11.22. A bearish candlestick is in the making to denote that a falling force is in motion.
Note: Cryptosignals.org is not a financial advisor. Do your research before investing your funds in any financial asset or presented product or event. We are not responsible for your investing results.
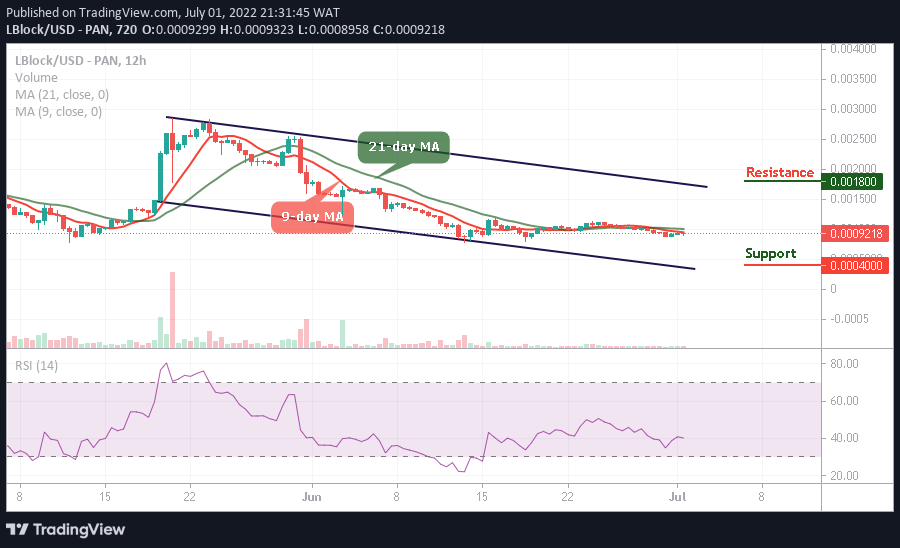
You can purchase Lucky Block here. Buy LBLOCK