Bitcoin (BTC/USD) Price Devalues to an Average of $21,000
Estimated Reading Time: 3 minutes
Don’t invest unless you’re prepared to lose all the money you invest. This is a high-risk investment and you are unlikely to be protected if something goes wrong. Take 2 minutes to learn more
Bitcoin Price Prediction – March 8
Variant trading activities in the BTC/USD market operations have been complying in a correction-moving mode as the crypto economy devalues to an average of $21,000. At an average minute negative percent of 0.43, the reduction pace in the transaction has been between the top and low of $22,326.33 and $21870.62. That said, the trending outlook still possesses a relatively bullish.
BTC/USD Market
Key Levels:
Resistance levels: $25,000, $26,000, $27,000
Support levels: $21,000, $20,000, $19,000
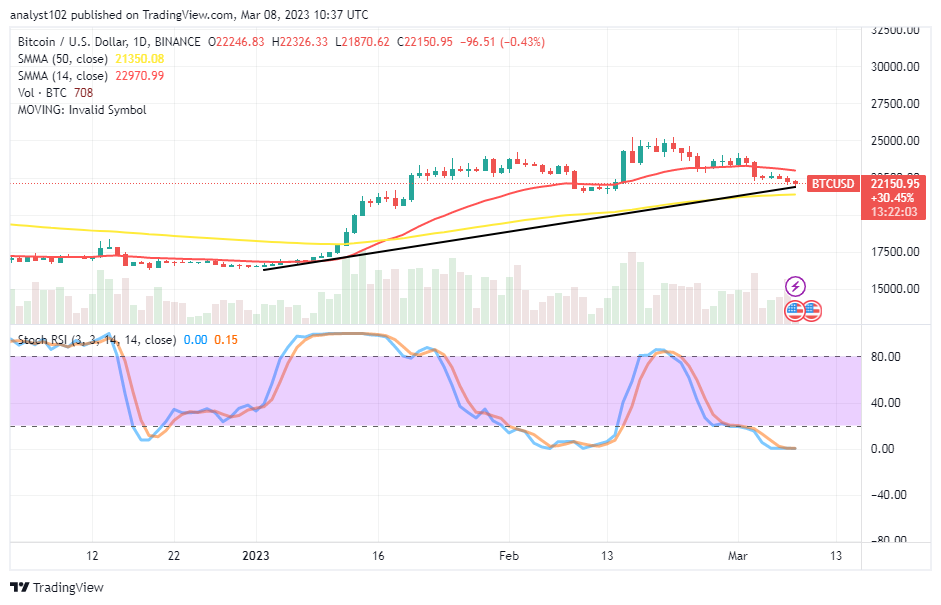
BTC/USD – Daily Chart
The BTC/USD daily chart mirrors the crypto-economic price devalues to an average of $21,000 support level at a close range. The 14-day SMA trend line is at $22,970.99 above the $21,350.08 value line of the 50-day SMA trend line. The bullish trend line moved northward around the larger signal to keep track of the potential lower trading range from which the market could soon make a recovery. The Stochastic Oscillators have traversed southbound to 0.15 and 0.00 levels in the oversold region.
What could be the BTC/USD market direction, considering the Stochastic Oscillators’ points on the chart?
Going by the present reading of the Stochastic Oscillators in the BTC/USD trade operations, it would be technically ideal to stop shorting orders even though the crypto market devalues to an average of $21,000 support level. Expectantly, buyers are to muster up energy that could lead to building up on the threshold of around the identified support trading spot soon. The converse of that assumption is that long positions might, for a while, permit falling moves to continue inactively and reach a low point of about $20,000 before making the necessary up swings again.
On the falling side of the BTC/USD technical analysis report, it would only take bears a consolidation-moving effort to establish farther against the underlaid value of around the bigger SMA in the following sessions. Nonetheless, it would not be psychological at this time to issue further shorting orders.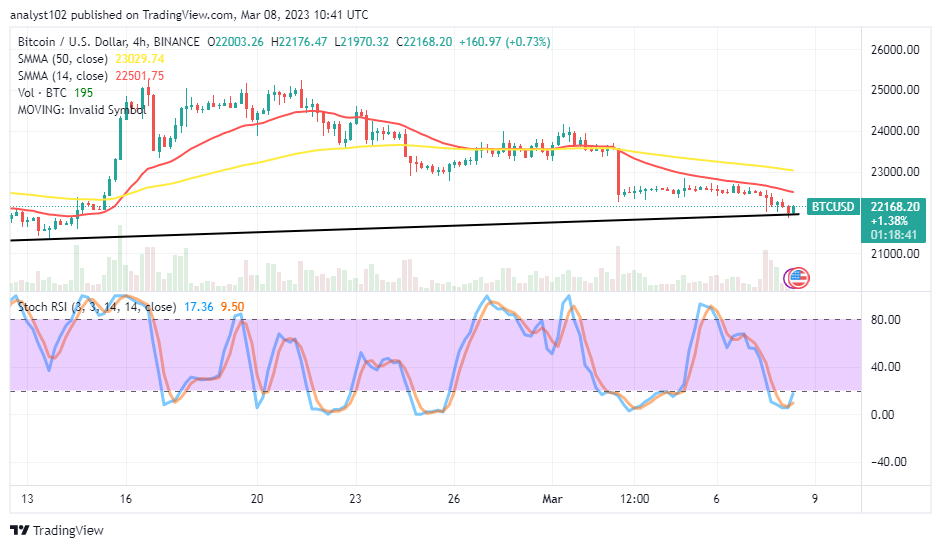
BTC/USD 4-hour Chart
The BTC/USD medium-term chart showcases the crypto-economic price devaluation to an average of $21,000 in the recent operations. The 14-day SMA indicator is at $22,501.75 underneath the 50-day SMA indicator, which is at the $23029.74 value line. The Stochastic Oscillators have crossed northbound to 9.50 and 17.36 levels from the oversold region. A smaller bullish trading candlestick has been in the making to a high point of $22,168.20. That demonstrates that buyers are about to cross some of the previously identified support points.
Note: Cryptosignals.org is not a financial advisor. Do your research before investing your funds in any financial asset or presented product or event. We are not responsible for your investing results.
You can purchase Lucky Block here. Buy LBLOCK


