Bitcoin (BTC/USD) Market Makes a Swing High From 14-day SMA
Estimated Reading Time: 3 minutes
Don’t invest unless you’re prepared to lose all the money you invest. This is a high-risk investment and you are unlikely to be protected if something goes wrong. Take 2 minutes to learn more
Bitcoin Price Prediction – March 1
There have been some degrees of declines in the BTC/USD trade in recent operations, but only to the point where the crypto market can now make a swing high from around the value of the 14-day SMA. As of the writing of this technical trading sentiment, the price carries a positive percentage rate of 2.36 to bargain at $23,949.87. It is worth noting that the underlying critical line is at $22,500.
BTC/USD Market
Key Levels:
Resistance levels: $25,000, $26,000, $27,000
Support levels: $22,000, $21,000, $20,000
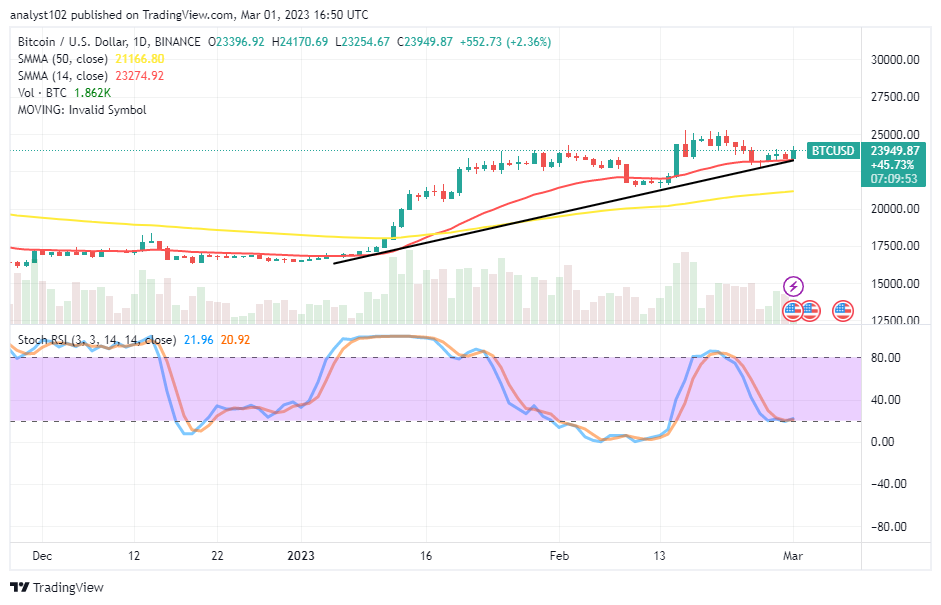
BTC/USD – Daily Chart
The BTC/USD daily chart showcases the crypto-economic market making a swing high from around the point of the 14-day SMA. The smaller SMA trend line is at a $23,274.92 value above the $21,166.80 of the 50-day SMA trend line. The bullish trend line is to keep the abrest of the lower path the trade has to spring northward back into its increment. The Stochastic Oscillators have traversed southbound to attempt crossing back northbound at 20.92 and 21.96 levels to demystify that an upward motion is in place.
Will the Bitcoin/USD market continue to push above the 14-day SMA trend line at $23,274.92?
The points between the 14-day SMA at $23,274.92 and the $22,500 will both act as the critical zones against an early reversal move of the current trading pace as the BTC/USD market makes a swing high from around the smaller trading indicator. Buyers ought to have taken advantage of the present situation from the scratch spot around the bullish trading candlestick. Long-position placers, on the other hand, may execute an instant order with a protective stop loss order around the latter mentioned at the beginning of this analytics paragraph.
On the bearish side of the BTC/USD technical analysis report, at this point, it has been that bears’ gravitational pressures have reached completion around the 14-day SMA indicator. Going by the portended levels of the Stochastic Oscillators, short-position takers need to exercise patience for a while until another resistance trading formation is achieved around the $25,000 if the price will push for a retest or extends to a higher resistance spot of around the $27,500.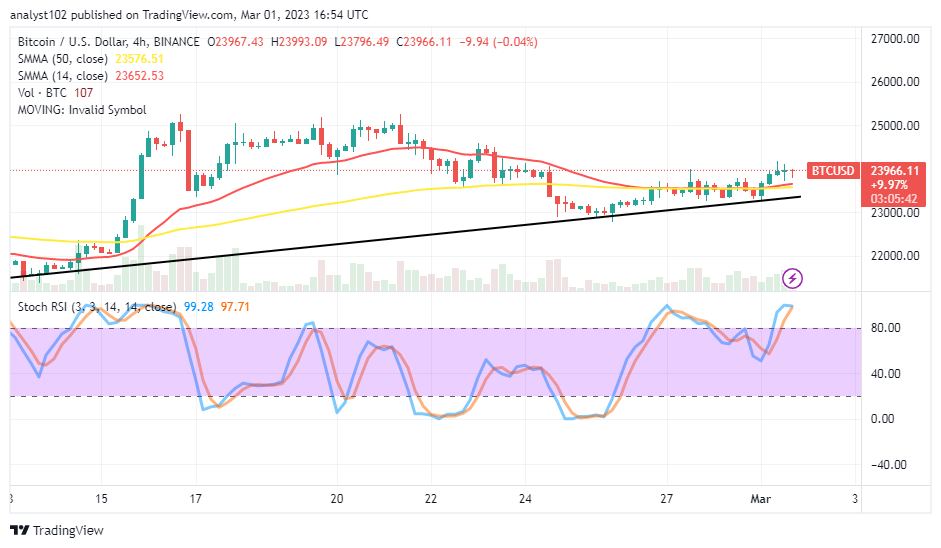
BTC/USD 4-hour Chart
The BTC/USD medium-term chart has shown the crypto market makes a swing high from the path of the bullish trend line drawn closely underneath the conjoined point of the SMA trend lines. The 14-day SMA indicator has curved southward to trend alongside the 50-day SMA indicator, slightly below the current trading spot. The Stochastic Oscillators have penetrated the overbought region at 97.71 and 99.28 levels. If bulls fail to add more force above the SMAs at $23,652.53 and $23,576.51, a pause will occur around $24,000.
Note: Cryptosignals.org is not a financial advisor. Do your research before investing your funds in any financial asset or presented product or event. We are not responsible for your investing results.
You can purchase Lucky Block here. Buy LBLOCK


