The Storj Market (STORJ/USD) Bulls Claim $0.40 for Support, Targeting $0.50 Price Milestone
Estimated Reading Time: 3 minutes
Don’t invest unless you’re prepared to lose all the money you invest. This is a high-risk investment and you are unlikely to be protected if something goes wrong. Take 2 minutes to learn more
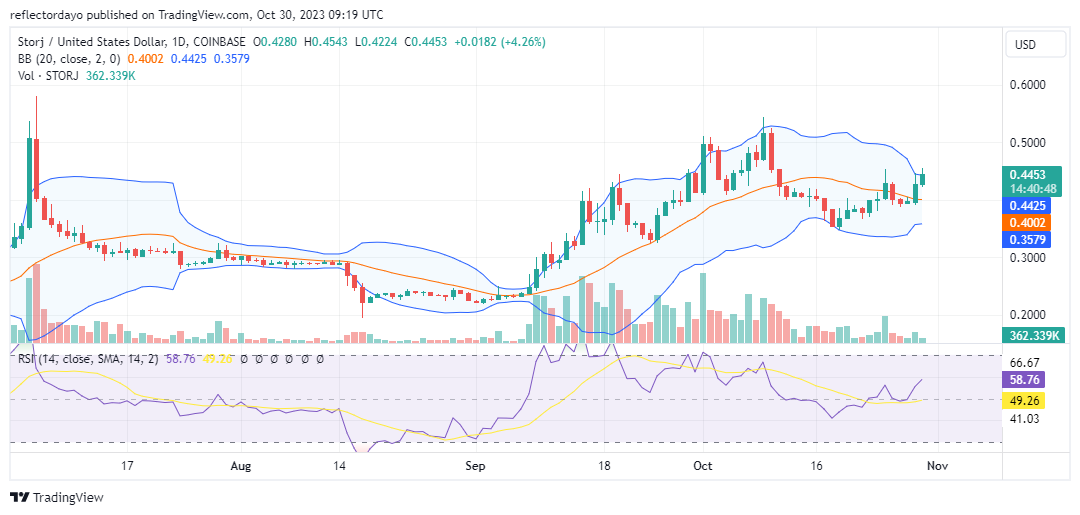
In late September, the $0.40 price level emerged as a significant milestone within the Storj market. Initially, it served as a foundation for the bullish trend, gathering substantial momentum that briefly propelled prices toward the $0.50 threshold before encountering resistance. Following this rejection of the bullish advance, the market retreated to the $0.40 price level, trading sideways for a period. Subsequently, bulls regrouped around the $0.35 mark to establish a new support level, enabling them to gradually reclaim $0.40 as a key support level.
The Storj Market Data
- STORJ/USD Price Now: $0.4491
- STORJ/USD Market Cap: $165,485,892
- STORJ/USD Circulating Supply: 369,601,919 STORJ
- STORJ/USD Total Supply: 424,999,998 STORJ
- STORJ/USD CoinMarketCap Ranking: #162
Key Levels
- Resistance: $0.45, $0.50, and $0.55.
- Support: $0.35, $0.30, and $2.50.
The Storj Market Price Forecast: Analyzing the Indicators
The Storj market has exhibited a prominent prevalence of upward price swings over downward movements, indicating a robust bullish presence in the market. This dynamic suggests the potential for further advances in price levels. As these bullish upswings persist, the market’s ability to secure higher support levels will contribute to the reinforcement of the upward momentum, thereby allowing for the attainment of higher price levels.
However, it is noteworthy that the Bollinger Bands indicator is presenting an intriguing observation. Despite the market’s noteworthy bullish performance, the Bollinger Bands are converging rather than diverging. This phenomenon implies a decline in market volatility as it approaches the $0.50 price level once more. Traders should consider this a cautionary signal that the bullish momentum may be losing some of its previous strength, potentially leading to a period of consolidation or even a reversal. This notion gains further credence from the trade volume indicator, which is currently showing histograms of reduced height. Assessing the market over different timeframes may provide additional insights into the potential outcome of these developments.
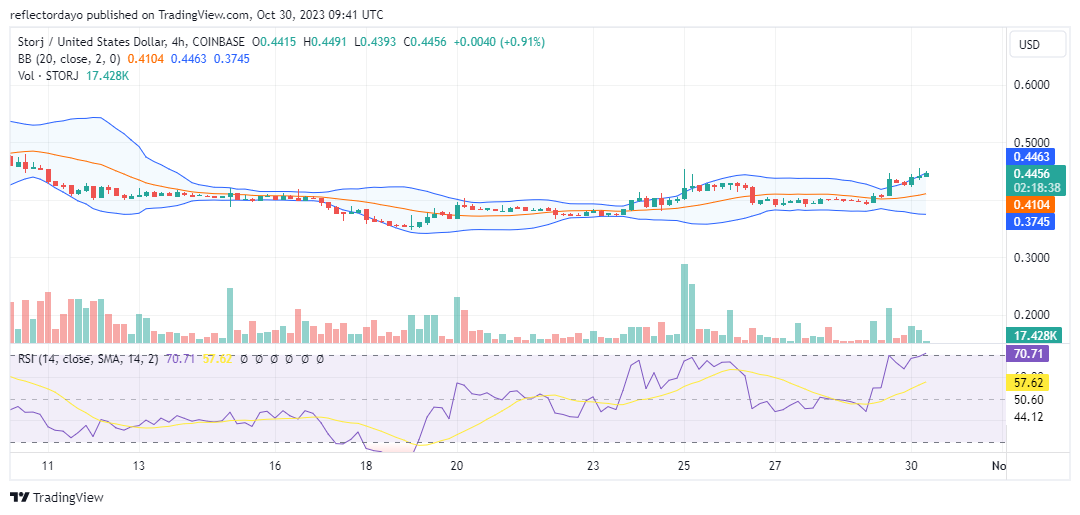
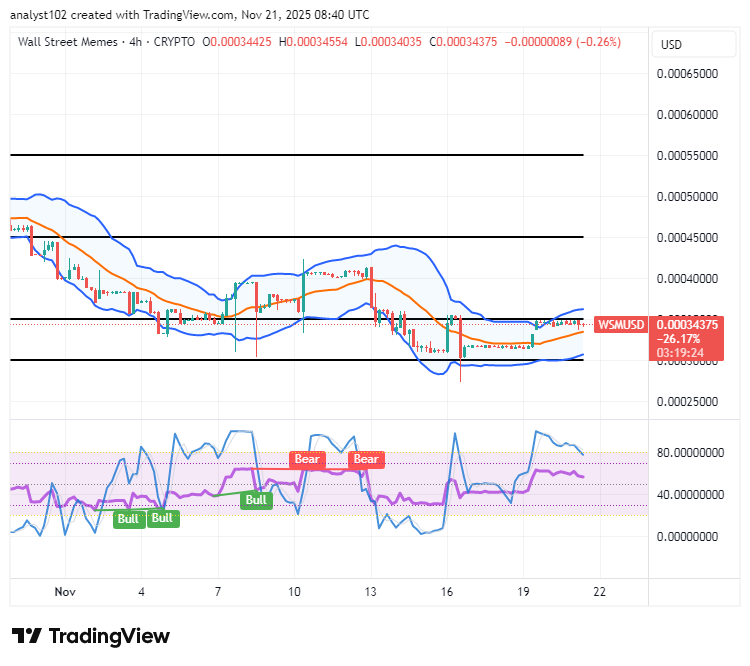
STORJ/USD 4-Hour Chart Outlook
Upon closer examination of the shorter timeframe, it becomes evident that the market has been engaged in a period of sideways consolidation near the $0.40 price level. Subsequently, a breakthrough from the price stagnation at $0.40 briefly transpired, instigated by an influx of buying activity. However, as the market approached the $0.45 price level, a noticeable disparity emerged between the price action and the trade volume indicator. This incongruity signifies a significant resistance barrier at the $0.45 price threshold.
The standoff between buyers and sellers at this particular price level may prompt a phase of consolidation, where the market is likely to trade within a defined range for a period. It is during this consolidation that the market will ultimately decide on its next direction—whether to continue the established trend or initiate a potential reversal.