Lucky Block Price Prediction: LBLOCK/USD Faces the Upside as Price Hovers at $0.000147
Estimated Reading Time: 2 minutes
Don’t invest unless you’re prepared to lose all the money you invest. This is a high-risk investment and you are unlikely to be protected if something goes wrong. Take 2 minutes to learn more
Lucky Block Price Prediction – November 22
The Lucky Block price prediction reveals that the bulls begin to increase their entries as the price heads to the north.
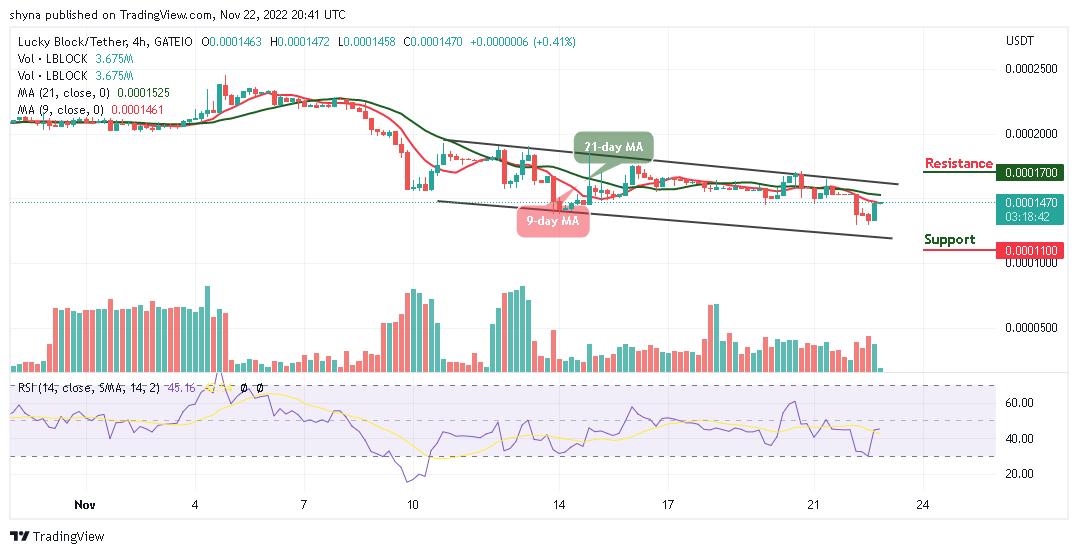
LBLOCK/USD Medium-term Trend: Ranging (4H Chart)
Key Levels:
Resistance levels: $0.000170, $0.00180, $0.000190
Support levels: $0.000110, $0.000100, $0.000090
LBLOCK/USD is moving bullishly as the coin heads toward the 9-day and 21-day moving averages. The bullish momentum is coming to play in the market, and the bullish pressure could break the $0.000160 level. Meanwhile, if the bulls fail to drive the price higher, the Lucky Block price may continue to consolidate before gaining additional profit.
Lucky Block Price Prediction: LBLOCK/USD Heads to the Upside
The Lucky Block price is changing hands at $0.000174 where it will make a cross above the 9-day and 21-day moving averages. As soon as the coin crosses above this barrier, LBLOCK/USD will locate the potential resistance levels at $0.000170, $0.000180, and $0.000190 while the support levels could be found at $0.000110, $0.000100, and $0.000090 so that new buyers can come into the market while the technical indicator Relative Strength Index (14) moves above 40-level.
LBLOCK/USD Medium-term Trend: Ranging (2H Chart)
After staying above the 9-day moving average, the Lucky Block price is about to cross above the 21-day moving average. The technical indicator Relative Strength Index (14) will also cross above the 50-level to confirm the upward movement. Therefore, any possible cross above the upper boundary of the channel could reach the resistance level at $0.000170 and above.
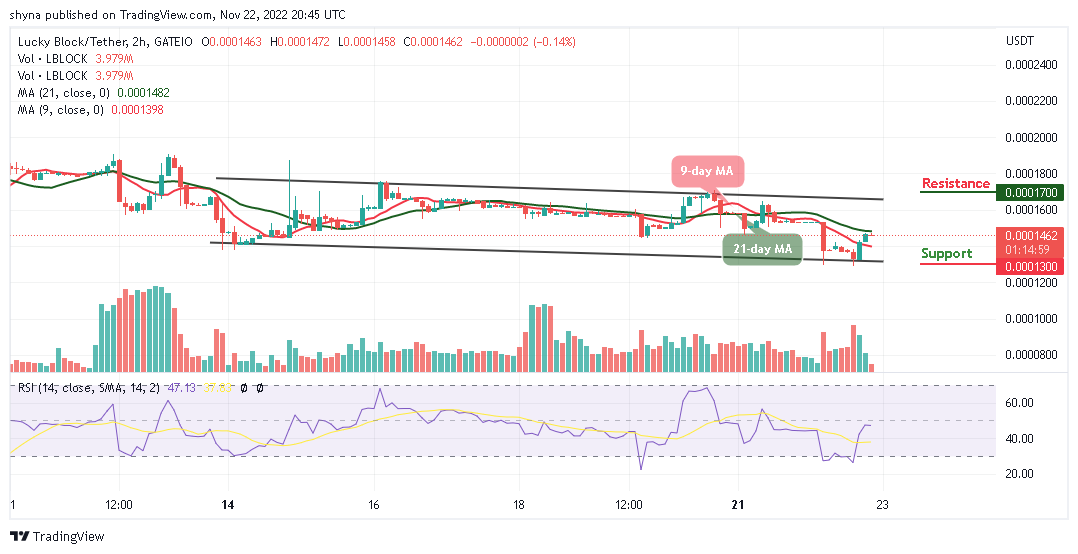
However, LBLOCK/USD will begin to display some bullish signals as the sideways movement fades out, but if the price drops and slides below the lower boundary of the channel, it could touch the nearest support at $0.000130 and below.
You can purchase Lucky Block here. Buy LBLOCK