LBLOCK/USD: Can it Break Through Key Resistance Levels?
Estimated Reading Time: 3 minutes
Don’t invest unless you’re prepared to lose all the money you invest. This is a high-risk investment and you are unlikely to be protected if something goes wrong. Take 2 minutes to learn more

Lucky Block (LBLOCK) Price Prediction – May 17
Lucky Block (LBLOCK) is showing slight positive movement in the volatile cryptocurrency market. As of today, LBLOCK is priced at $0.0000326, marking a 0.15% increase over the past 24 hours.
During this period, 422,634,093 LBLOCK coins were traded, resulting in a trading volume of $13,672. With a total supply of 99,600,521,808 LBLOCK, the market sentiment appears cautiously optimistic.
LBLOCK/USD Long-Term Trend: Neutral (Daily Chart)
Key Levels:
Resistance: $0.00003300, $0.00003400, $0.00003500
Support: $0.00003100, $0.00003000, $0.00002900
On the daily chart, LBLOCK’s Relative Strength Index (RSI) is at 53, indicating a neutral market position without strong bullish or bearish signals. The current price is slightly above the middle Bollinger Band, suggesting stability within this trading range.
Immediate resistance is seen at $0.00003300. A breakthrough at this level could open the path to the next resistance levels at $0.00003400 and $0.00003500.
Conversely, support levels are at $0.00003100, with further support at $0.00003000 and $0.00002900, which could act as a floor for any potential downward corrections.
LBLOCK/USD Medium-Term Trend: Bullish (4H Chart)
On the 4-hour chart, LBLOCK’s RSI is at 61, indicating a bullish sentiment. As for the Bollinger Bands, the price is currently near the upper band, indicating upward momentum. 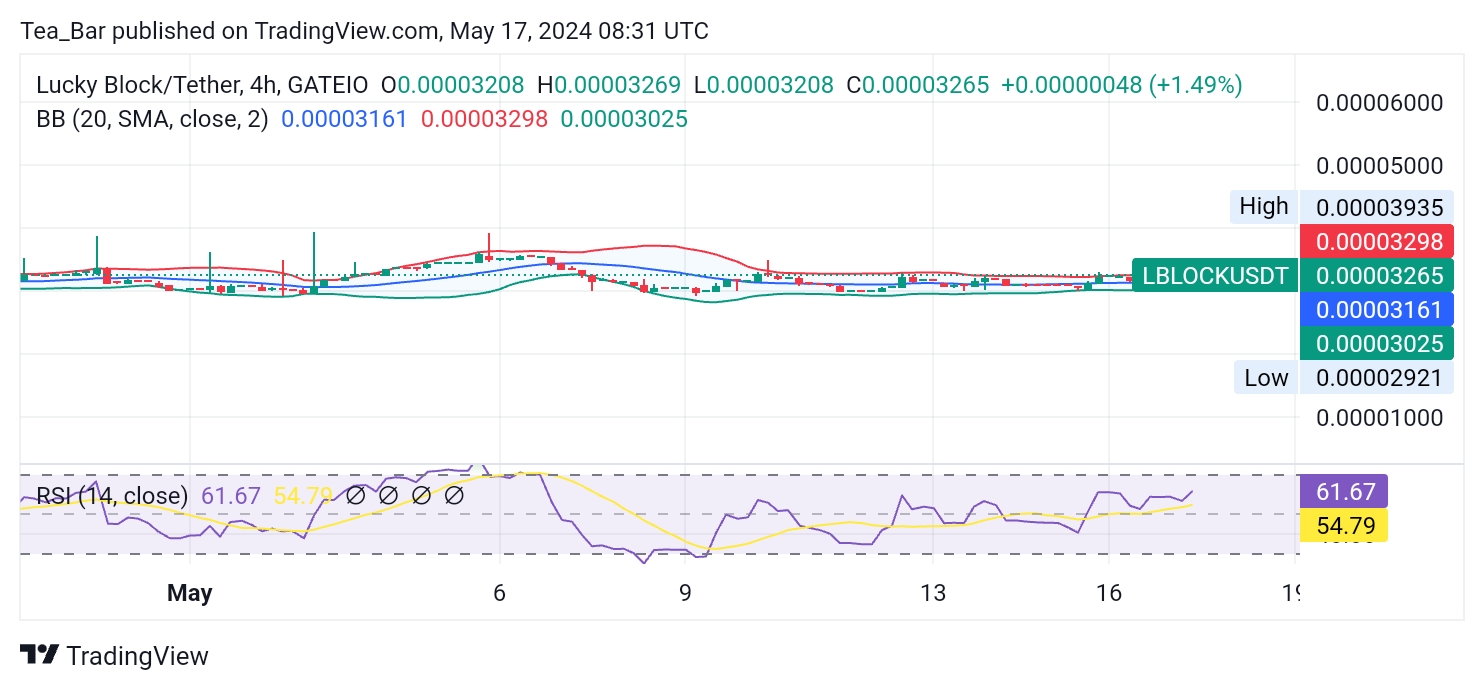
If LBLOCK can maintain its position above the middle Bollinger Band ($0.00003161) and break through the immediate resistance at $0.00003300, it could confirm a bullish trend and potentially reach higher resistance levels at $0.00003400 and $0.00003500.
Strategic Insights
LBLOCK shows promise for further upward movement in both the short and long term. Key resistance and support levels will play a pivotal role in determining the next direction.
The RSI on both the daily and 4-hour charts suggests potential gains, especially if the price can break through the immediate resistance levels.
The recent price increase and trading volume reflect cautious optimism in the market. For short-term traders, breaking through the $0.00003300 resistance level is crucial for confirming a bullish trend. Maintaining support above $0.00003100 will be vital to avoid downward pressure and sustain the upward trajectory.
You can purchase Lucky Block here. Buy LBLOCK.