Is Lucky Block (LBLOCK) Positioned for a Resilient Recovery?
Estimated Reading Time: 3 minutes
Don’t invest unless you’re prepared to lose all the money you invest. This is a high-risk investment and you are unlikely to be protected if something goes wrong. Take 2 minutes to learn more
Lucky Block (LBLOCK)Price Prediction – May 11
Lucky Block (LBLOCK) is currently trading at $0.0000310, experiencing a 24-hour trading volume of $14,355. Over the past 24 hours, 463,224,958 LBLOCK coins were exchanged, reflecting a decrease of -4.37% in price.
Looking back one week, LBLOCK was valued at $0.00002946, marking a weekly decline of -7.64%. Notably, LBLOCK reached its peak price on March 09, 2022, hitting an all-time high of $0.005471.
Since then, approximately 2 years and 2 months have passed. The minimum level LBLOCK dropped to after its all-time high is $0.000009049307, showing an impressive increase of 242.46% from that low.
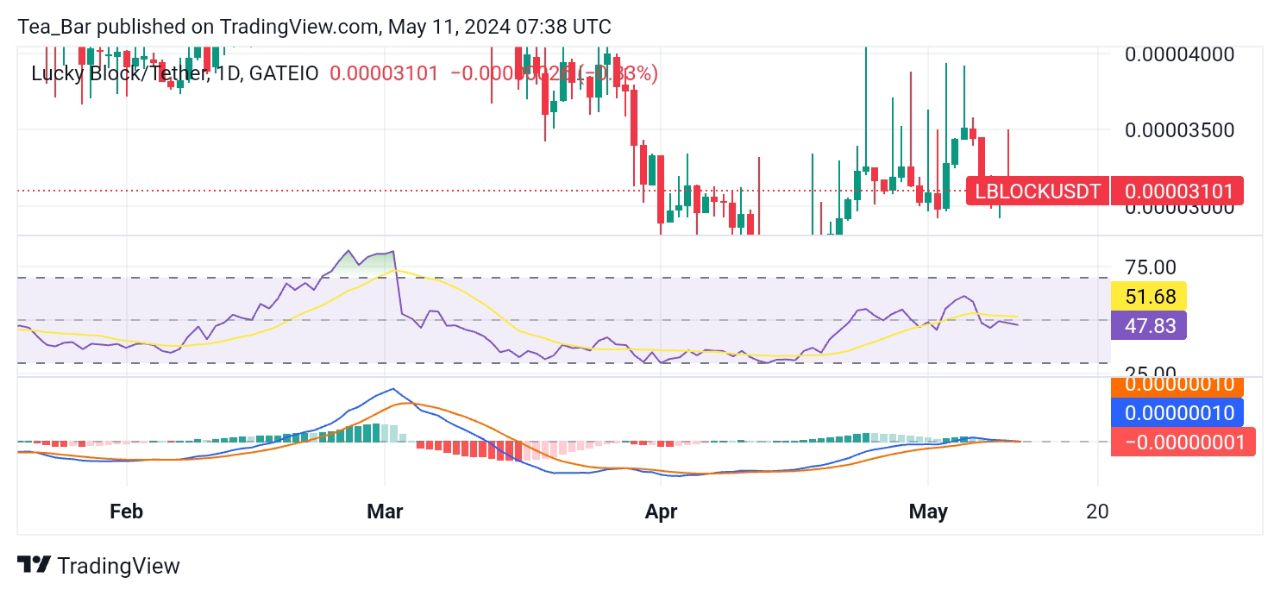
LBLOCK/USD Long-term Trend: Bearish (Daily Chart)
Key levels:
Resistance Levels: $0.0000325, $0.0000350, $0.0000370
Support Levels: $0.0000300, $0.0000250, $0.0000200
Examining the technical indicators, the 1-day chart displays an RSI of 47.83, indicating a neutral market sentiment. Additionally, the MACD on the zero line with small and faded green histograms suggests a potential reversal in momentum.
The initial support for Lucky Block is identified around $0.0000300, a crucial level where buying interest may increase. If the price falls below this point, further support could be found near $0.0000250, indicating a significant level of price stability.
On the other hand, the immediate resistance for Lucky Block is observed at $0.0000325, representing a critical barrier where selling pressure may intensify. Beyond this level, a stronger resistance is located around $0.0000350, indicating a potential point of trend reversal.
LBLOCK/USD Medium-term Trend: Bearish (4H Chart)
The 4-hour chart suggests a slightly bearish sentiment in the short term for Lucky Block (LBLOCK), as both the RSI and MACD indicate downward momentum. 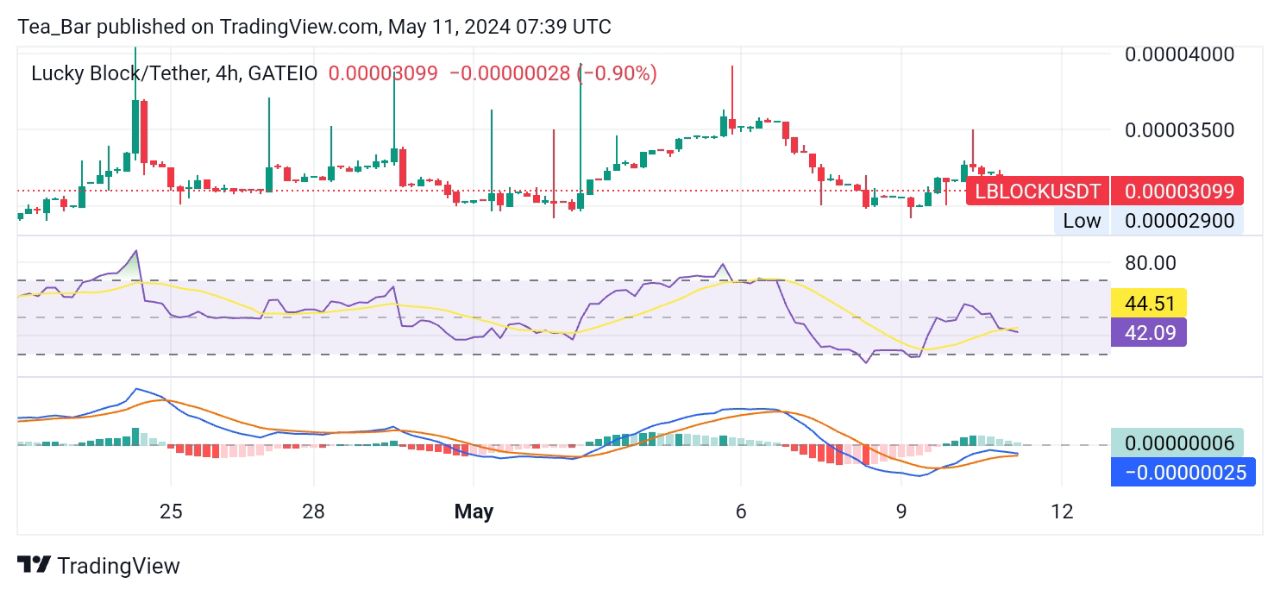
The RSI shows a reading of 42.09, indicating a slightly oversold condition. Additionally, the MACD (Moving Average Convergence Divergence) indicator is below the zero line, with a reading of -0.00000025.
The MACD is a trend-following momentum indicator that shows the relationship between two moving averages of a security’s price. When the MACD crosses below the signal line (the zero line), it can indicate a bearish signal, suggesting that selling pressure may be increasing.
Conclusion
Despite recent price declines and short-term bearish sentiment, Lucky Block (LBLOCK) shows resilience in the face of market challenges. While the 4-hour chart suggests downward momentum, the long-term outlook remains promising.
With support levels firmly established and potential for a reversal indicated by technical indicators, investors have reasons to remain optimistic.
The recent history of LBLOCK’s performance, including its impressive recovery from previous lows, hints at the asset’s potential to rebound and continue its upward trajectory. As the market continues to evolve, LBLOCK holders can look forward to brighter days ahead.
You can purchase Lucky Block here.Buy LBLOCK.