Lucky Block Price Prediction: LBLOCK/USD Sets to Retrace Above $0.000030
Estimated Reading Time: 3 minutes
Don’t invest unless you’re prepared to lose all the money you invest. This is a high-risk investment and you are unlikely to be protected if something goes wrong. Take 2 minutes to learn more
Lucky Block Price Prediction – October 16
The Lucky Block (LBLOCK) rebounds from the early dip at $0.000026 as the buying interest may increase on approach to $0.000030.
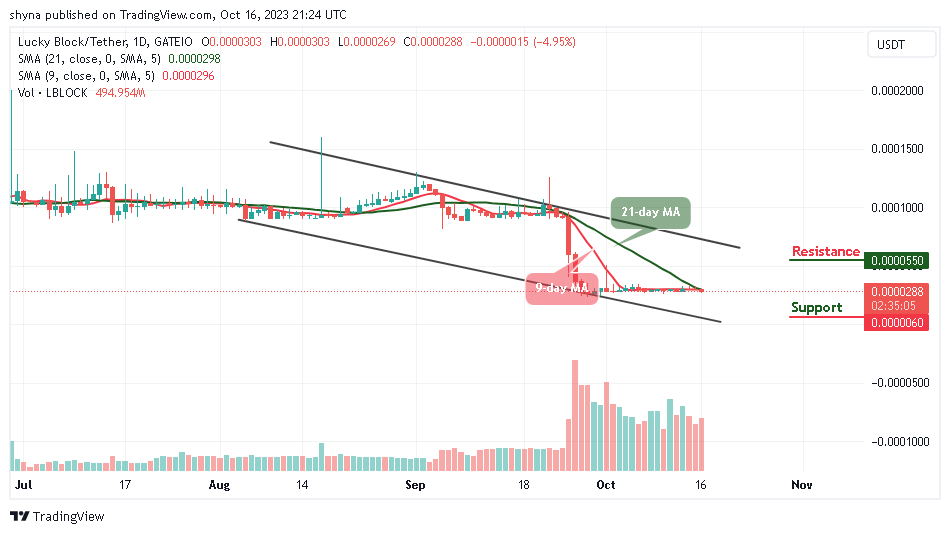
LBLOCK/USD Long-term Trend: Bearish (Daily Chart)
Key levels:
Resistance Levels: $0.000055, $0.000057, $0.000059
Support Levels: $0.000006, $0.000005, $0.000004
LBLOCK/USD is ranging as the market established a lower low of around $0.000026 in the last few hours but currently moving higher to retest previous support at $0.000030. The bulls are finding some stiff resistance around the $0.000028 on the road to recovery and the path of least resistance appears to the upside in the near term amid a favorable bullish technical setup.
Lucky Block Price Prediction: What Would Happen to Lucky Block Price?
In the past few hours, after the Lucky Block price touched the daily high of $0.000030, the coin has been trying to cross above the 9-day and 21-day moving averages, looking forward to touching another resistance level of $0.000032. However, the daily chart technically reveals that if the red line of the 9-day moving average crosses above the green line of the 21-day moving average, this will determine the next direction that the coin will follow.
However, the bears could take advantage to break the support of $0.000028 if the bulls fail to push the price above the moving averages. Therefore, if the Lucky Block price crosses above this barrier, it could hit the resistance levels of $0.000055, $0.000057, and $0.000059 but crossing below the lower boundary of the channel could meet the supports at $0.000006, $0.000005, and $0.000004 respectively.
LBLOCK/USD Medium-Term Trend: Ranging (4H Chart)
According to the 4-hour chart, the Lucky Block price is facing the upside as the coin moves to cross above the moving averages. On the upside, if the price crosses above the resistance level of $0.000030 in the short term, bullish influence could spike and the accrued gains massively.
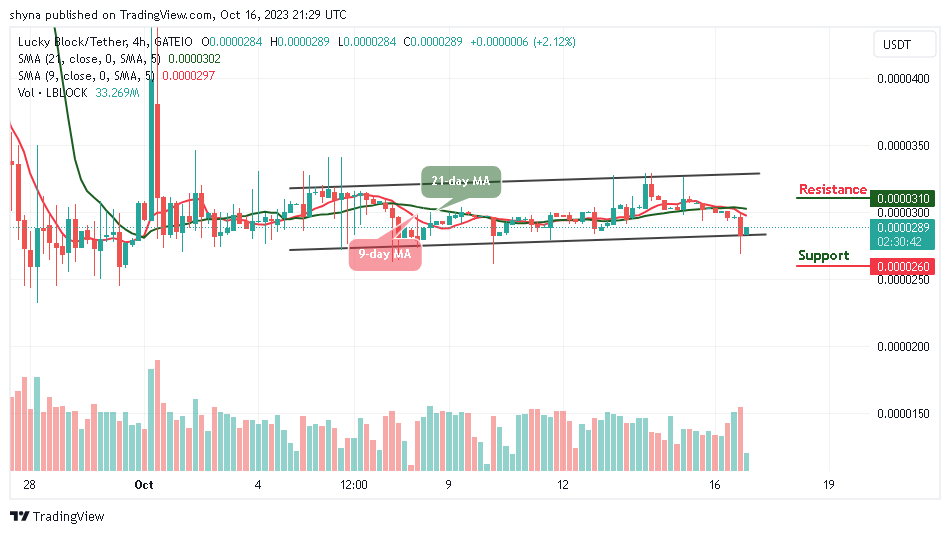
However, the current candle could fall to a tentative support level at $0.000027. On the downside, the ultimate target remains at $0.000026 and below. Moreover, the best the bulls can do is to hold above the weak support at $0.000027 and keep their attention on breaking the resistance at $0.000031 and above.
You can purchase Lucky Block here. Buy LBLOCK