Lucky Block (LBLOCK) Gearing Up for a Breakout – Is Now the Perfect Time to Buy?
Estimated Reading Time: 3 minutes
Don’t invest unless you’re prepared to lose all the money you invest. This is a high-risk investment and you are unlikely to be protected if something goes wrong. Take 2 minutes to learn more

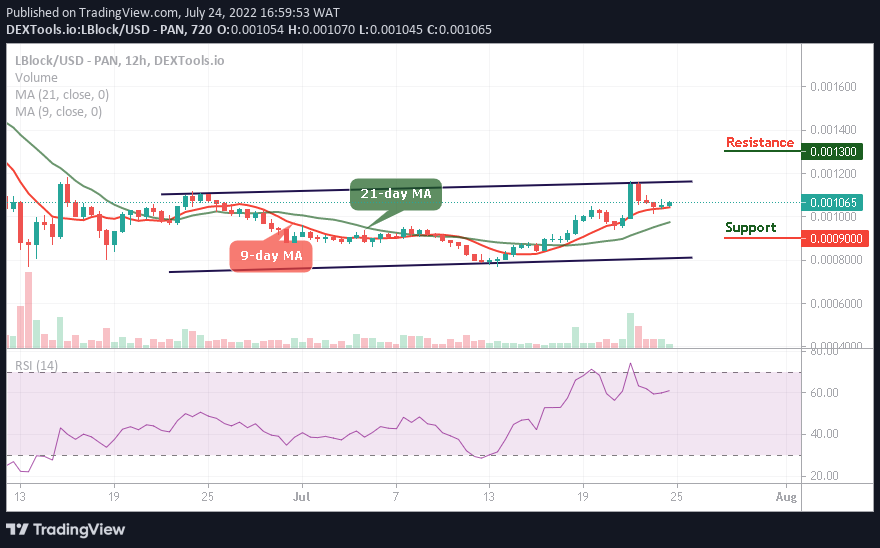
Lucky Block (LBLOCK) has been navigating a period of price consolidation, showing resilience amid market fluctuations. While the price has dipped slightly in the past 24 hours, technical indicators suggest that bullish momentum could be building. Traders are closely watching for potential breakout signals as LBLOCK continues to maintain key support levels.
LBLOCK Daily Chart Analysis: Building Momentum for a Breakout
Lucky Block is currently trading at $0.00001323, reflecting a 1.12% decline for the day. Despite this minor pullback, the price has remained above its critical support level of $0.00001123, indicating strong buying interest at lower levels. The Parabolic SAR indicator shows that the market has been in a downtrend, with dots appearing above the price action. However, as these dots draw closer, it suggests that a reversal may be imminent. A shift in this trend could lead to a bullish breakout, pushing LBLOCK toward its immediate resistance at $0.00001839 and potentially higher toward the recent peak of $0.00004253.
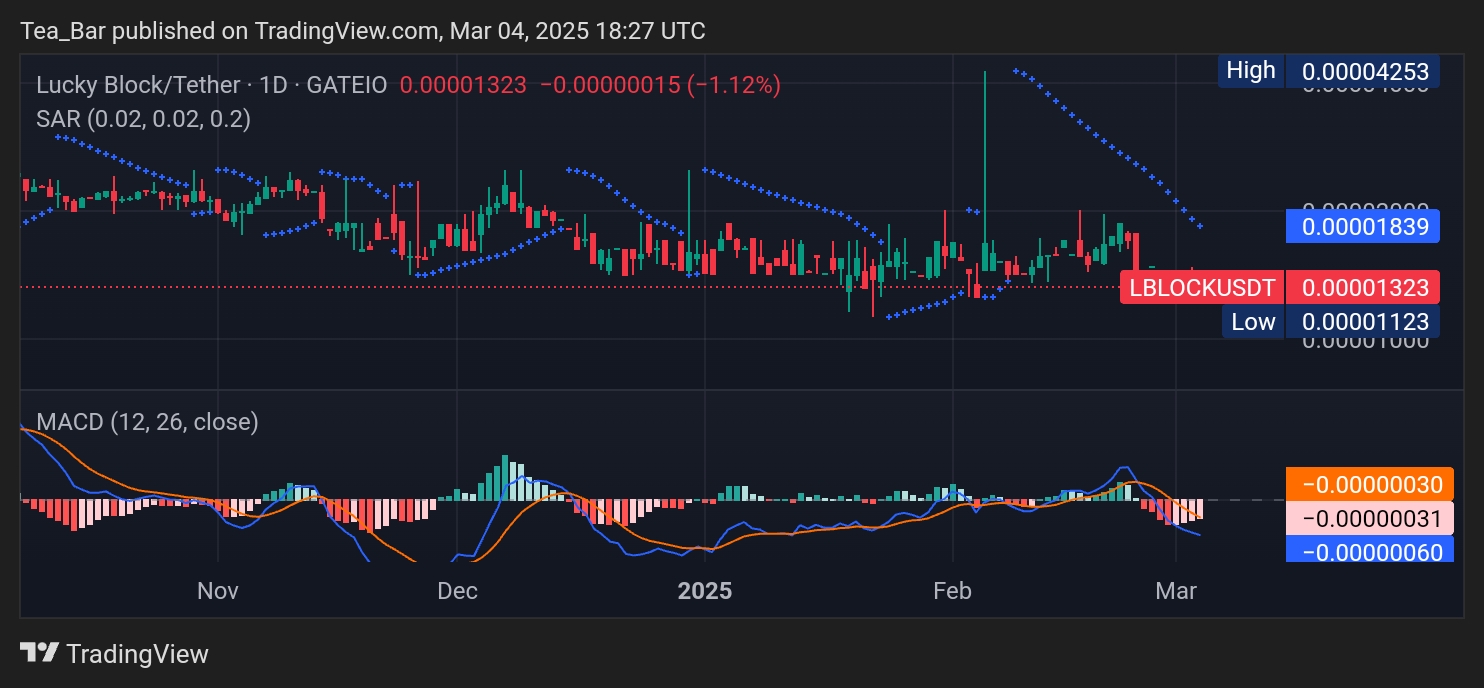
The MACD histogram is also showing encouraging signs, as bearish momentum appears to be fading. The MACD line is curving upward, hinting at a possible crossover that could trigger increased buying pressure. If this pattern follows through, it could confirm a trend reversal and open the door for a sustained uptrend.
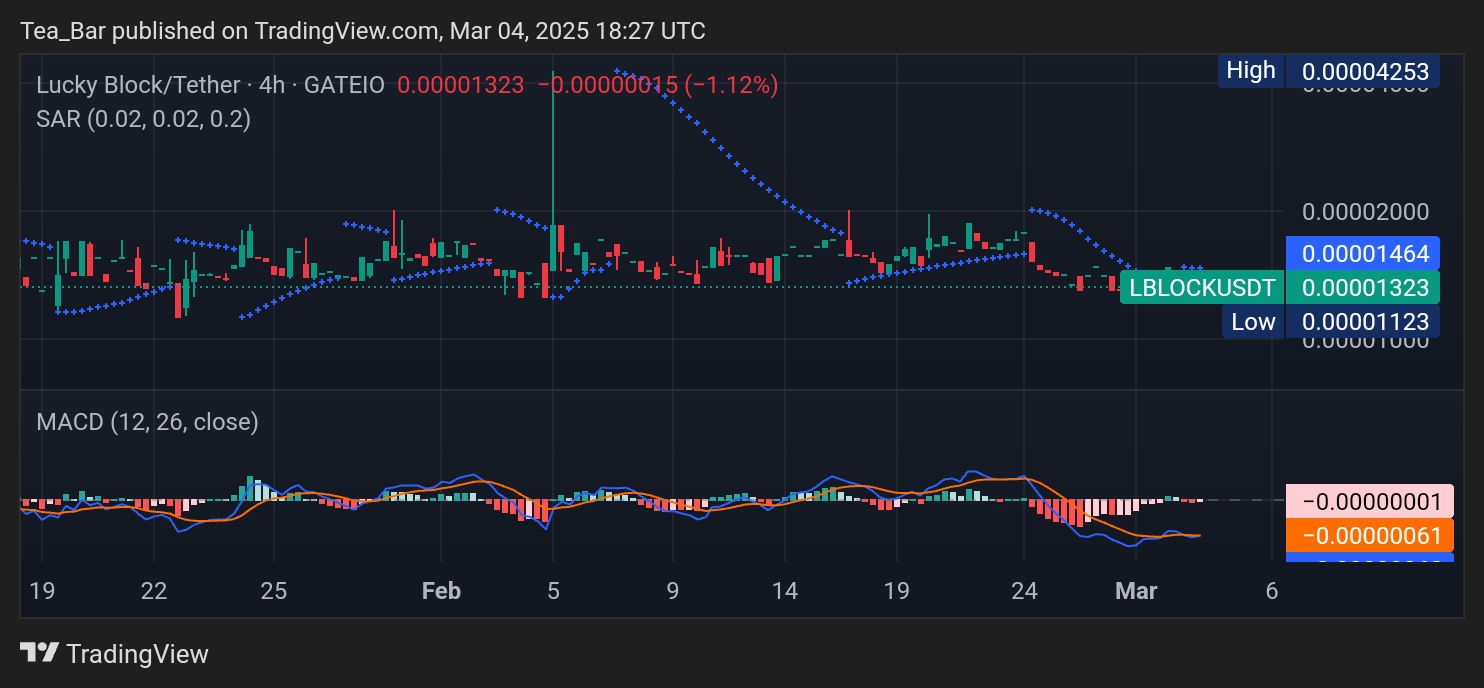
4-Hour Chart Signals: Stability Before a Potential Surge
The four-hour chart reflects a stabilizing market, with Lucky Block holding steady around $0.00001323. The price has been oscillating within a narrow range, finding support at $0.00001123 while facing mild resistance at $0.00001464. The Parabolic SAR dots are shifting closer to the price action, indicating that selling pressure is weakening. If LBLOCK can maintain its current position and attract more volume, a breakout beyond $0.00001464 could be the next move.
The MACD on the four-hour timeframe is nearing neutrality, with bearish momentum subsiding. This suggests that the market is at a potential turning point. If buyers step in, LBLOCK could quickly target $0.00002000 as the next resistance level, reinforcing the bullish outlook.
Final Thoughts: Is LBLOCK Ready for a Rally?
Lucky Block continues to present itself as an intriguing asset, showing potential for a breakout despite recent price fluctuations. If the MACD confirms a bullish crossover and the Parabolic SAR shifts to a positive trend, the coin could see a renewed surge in buying interest. With a solid support base and technical indicators pointing toward a possible upward move, LBLOCK remains a crypto asset worth monitoring closely. Traders should keep an eye on the key resistance levels, as a move above $0.00001839 could mark the beginning of a new bullish phase.
Invest wisely, and let Lucky Block’s potential work in your favor. You can purchase Lucky Block here. Buy LBLOCK.