Lucky Block (LBLOCK) Gears Up for a Potential Breakout – Price Analysis for February 25, 2025
Estimated Reading Time: 2 minutes
Don’t invest unless you’re prepared to lose all the money you invest. This is a high-risk investment and you are unlikely to be protected if something goes wrong. Take 2 minutes to learn more

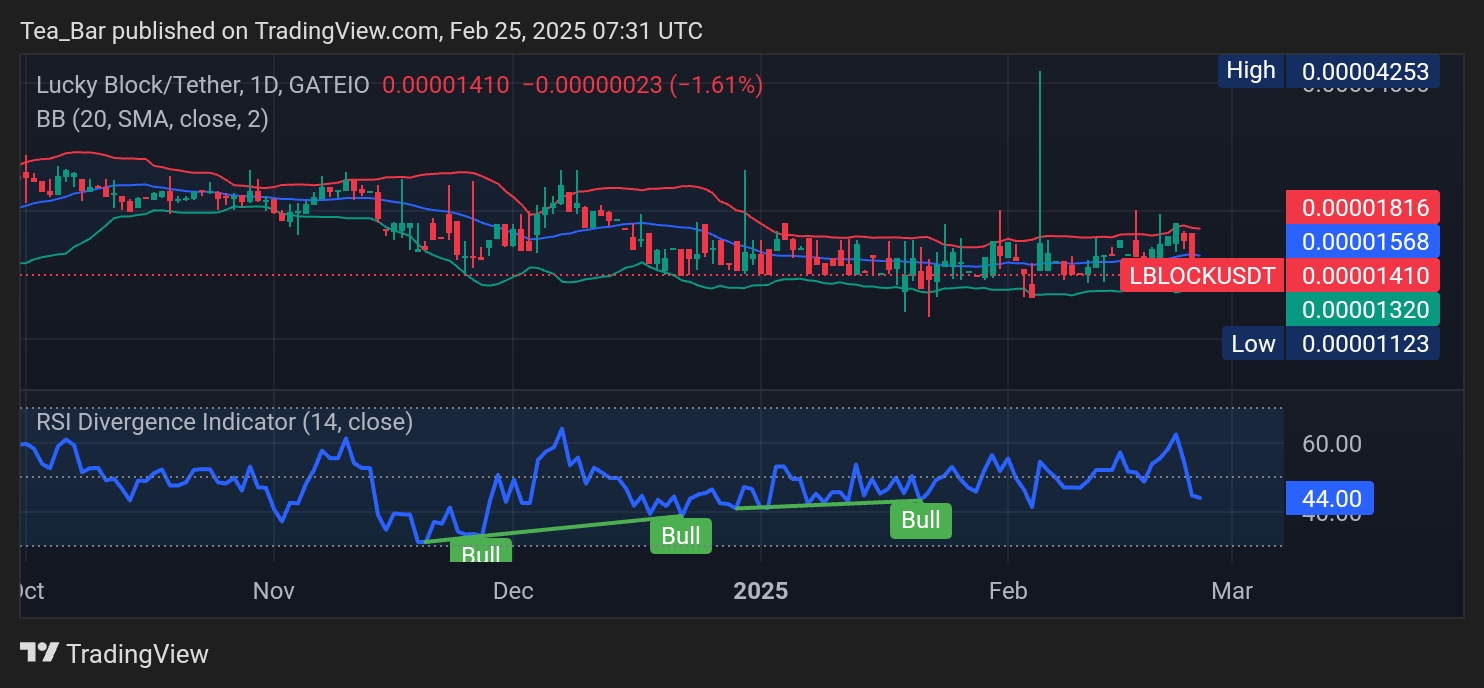
Lucky Block (LBLOCK) is currently priced at $0.00001410, experiencing a -1.61% decline. The daily chart reveals a period of consolidation, with prices fluctuating within the Bollinger Bands range. The upper resistance stands at $0.00001816, while support is found at $0.00001320, with a lower limit of $0.00001123.
The Relative Strength Index (RSI) is at 44.00, indicating neutral momentum with no overbought or oversold conditions. Notably, previous bullish divergences on the RSI suggest potential upward movement if market sentiment improves.
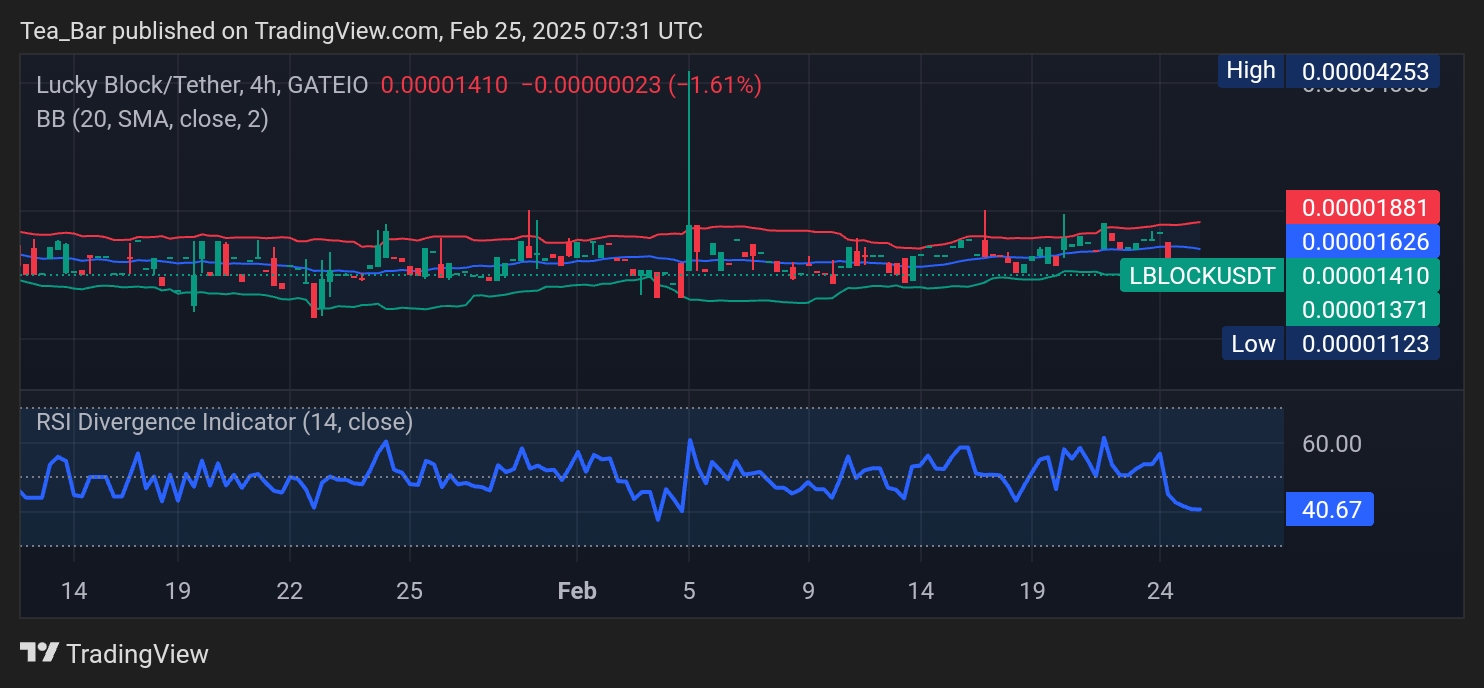
4-Hour Chart Analysis
On the 4-hour chart, LBLOCK maintains a tight trading range with resistance at $0.00001881 and support at $0.00001371. The Bollinger Bands show low volatility, hinting at a possible breakout in either direction.
The RSI stands at 40.67, suggesting mild bearish pressure. However, any upward push beyond $0.00001626 could trigger a stronger move toward the next resistance.
Conclusion
Lucky Block is in a consolidation phase but retains potential for a bullish breakout. If momentum picks up and RSI trends upward, LBLOCK could test $0.00001816 in the short term. Holding above $0.00001320 will be crucial for maintaining bullish potential.
Invest wisely, and let Lucky Block’s potential work in your favor. You can purchase Lucky Block here. Buy LBLOCK.