Uniswap (UNI/USD) Price Is on Track to Complete the Correction
Estimated Reading Time: 3 minutes
Don’t invest unless you’re prepared to lose all the money you invest. This is a high-risk investment and you are unlikely to be protected if something goes wrong. Take 2 minutes to learn more

Free Crypto Signals Channel
Uniswap Price Prediction – October 13
There has been a notion that the UNI/USD market price is on track to complete the correction it embarked upon some days ago. The last hours have witnessed a high and a low of $6.055 and $5.5214 at an average negative percentage rate of 6.92.
UNI/USD Market
Key Levels:
Resistance levels: $7, $7.50, $8
Support levels: $5, $4.50, $4
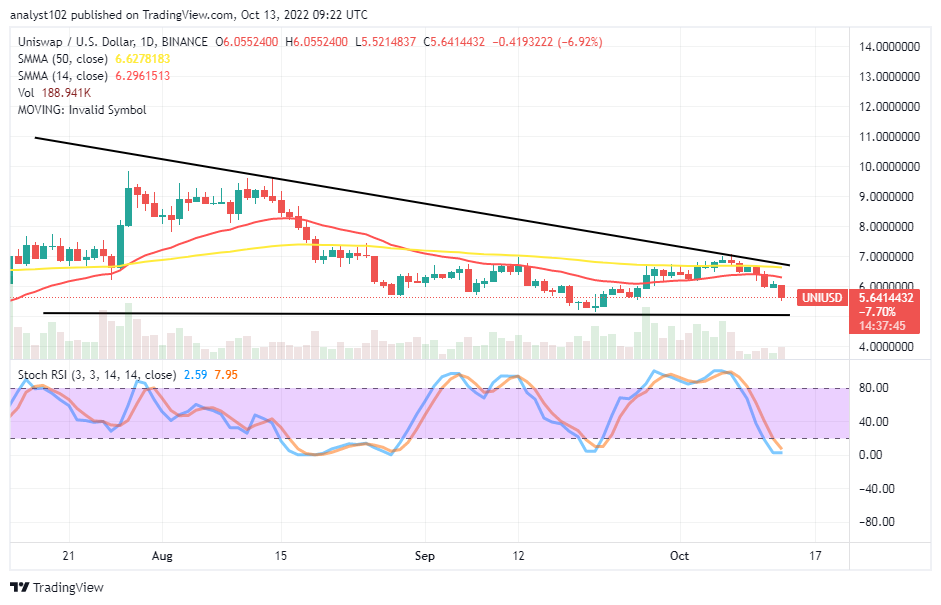
UNI/USD – Daily Chart
The UNI/USD daily chart reveals the crypto-market price is on track to complete the correction it started about a week ago while it failed to break past the $7 resistance level on Friday’s 7th session. The horizontal line drew at the $5 support level to mark the maximum expected lower-trading zone of the downward-trending move. The 14-day SMA is at $6.2961 below the $6.6278 value line. At range values of 7.95 and 2.59, the stochastic oscillators are measured and sank into the oversold area.
Will the UNI/USD market bears push to the $5 support?
The UNI/USD trade bears’ activities will likely continue to impact the crypto economy even though the price is on track to complete the correction it started several days ago until a lower is in focus. The reading of the Stochastic Oscillators affirming the possibility of the blue line crossing the red line to the northbound will signify the potency of buyers to make a comeback in the near time. Long-position placers would have to wait for the emergence of a bullish candlestick before executing a round of buying orders.
On the downside of the technical analysis, it is indicated until the present time that a declining motion is on a relative increase, seemingly creating a profiteering condition for the UNI/USD market bears. However, sellers should be wary of an occurrence of a rebound in no time, especially if the market pushes more to approach the $5 support value.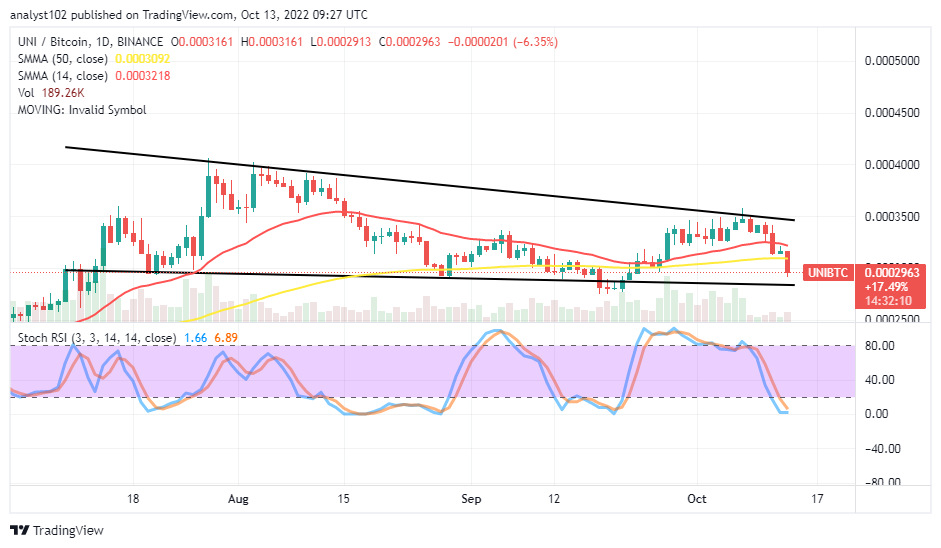
UNI/BTC Price Analysis
It shows on the analysis trading chart that the UNI/BTC market price is on track to complete the correction it began some days ago. Because a bearish candlestick has nearly enlarged a wall close to the horizontal line drawn below the trend lines of the SMAs, the Uniswap market tends to relax a little bit more in comparison to Bitcoin’s trending ability. The 14-day SMA has slightly bent southward near above the 50-day SMA. The Stochastic oscillators have fewer range points to touch in the oversold region, as they are around 6.89 and 1.66. At this time, the appearance of a bullish candlestick will indicate that the base cryptocurrency will possibly restore its lost momentum in the subsequent operations.
Note: Cryptosignals.org is not a financial advisor. Do your research before investing your funds in any financial asset or presented product or event. We are not responsible for your investing results.
You can purchase Lucky Block here. Buy LBLOCK