Lucky Block (LBLOCK) Sees Bullish Momentum: Price Analysis & Key Insights
Estimated Reading Time: 3 minutes
Don’t invest unless you’re prepared to lose all the money you invest. This is a high-risk investment and you are unlikely to be protected if something goes wrong. Take 2 minutes to learn more

Lucky Block (LBLOCK) is showing signs of a potential breakout as it gains traction in the market. With a current price of $0.00001748, representing a 4.42% increase, LBLOCK’s bullish momentum is becoming evident.
Daily Chart Analysis: Positive Trends Emerging
On the daily chart, the Parabolic SAR (Stop and Reverse) is beginning to show a shift, signaling possible bullish strength. The SAR dots have moved below the price, indicating a potential uptrend. Additionally, the MACD (Moving Average Convergence Divergence) histogram has reduced its bearish momentum, with the MACD line approaching a bullish crossover. This suggests growing buying interest and a possible move towards higher resistance levels.
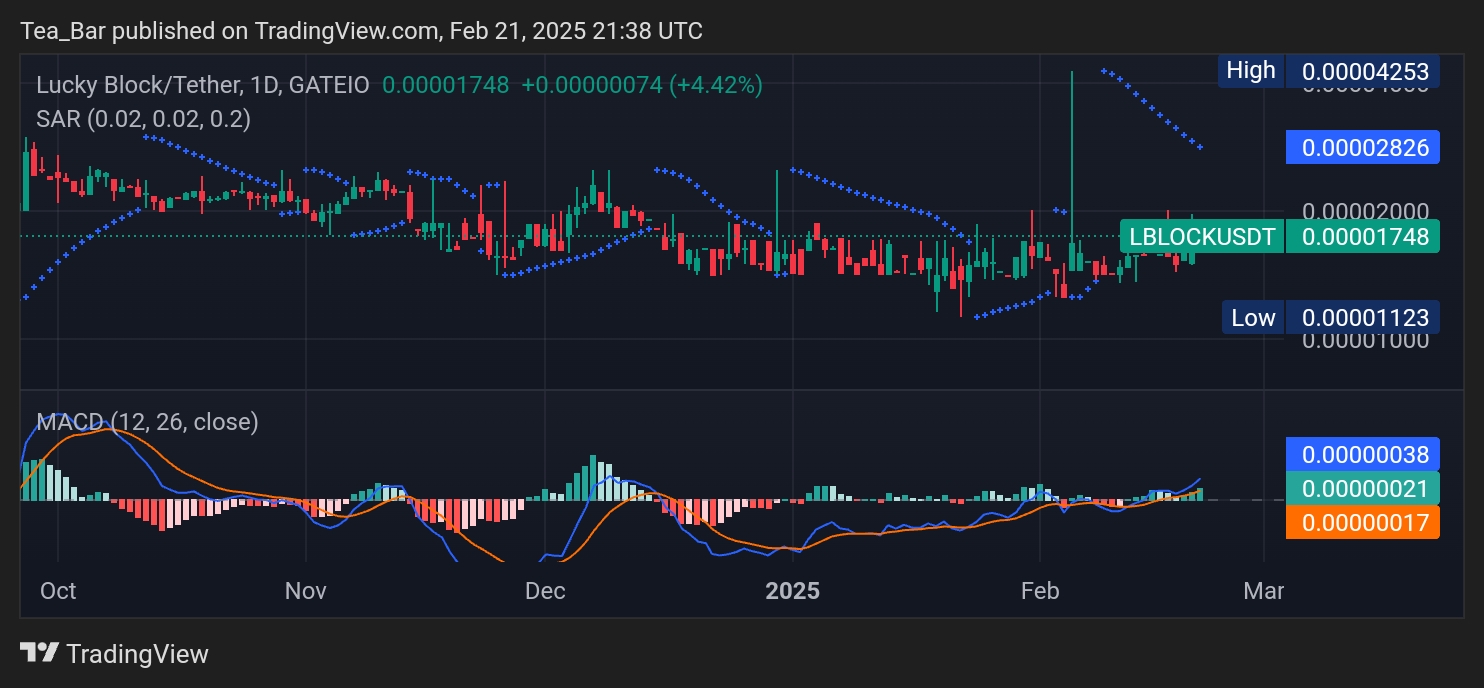
The key resistance levels to watch are $0.00002826 and $0.00004253, while strong support remains at $0.00001123. A breakout above the resistance could trigger a stronger rally for LBLOCK.
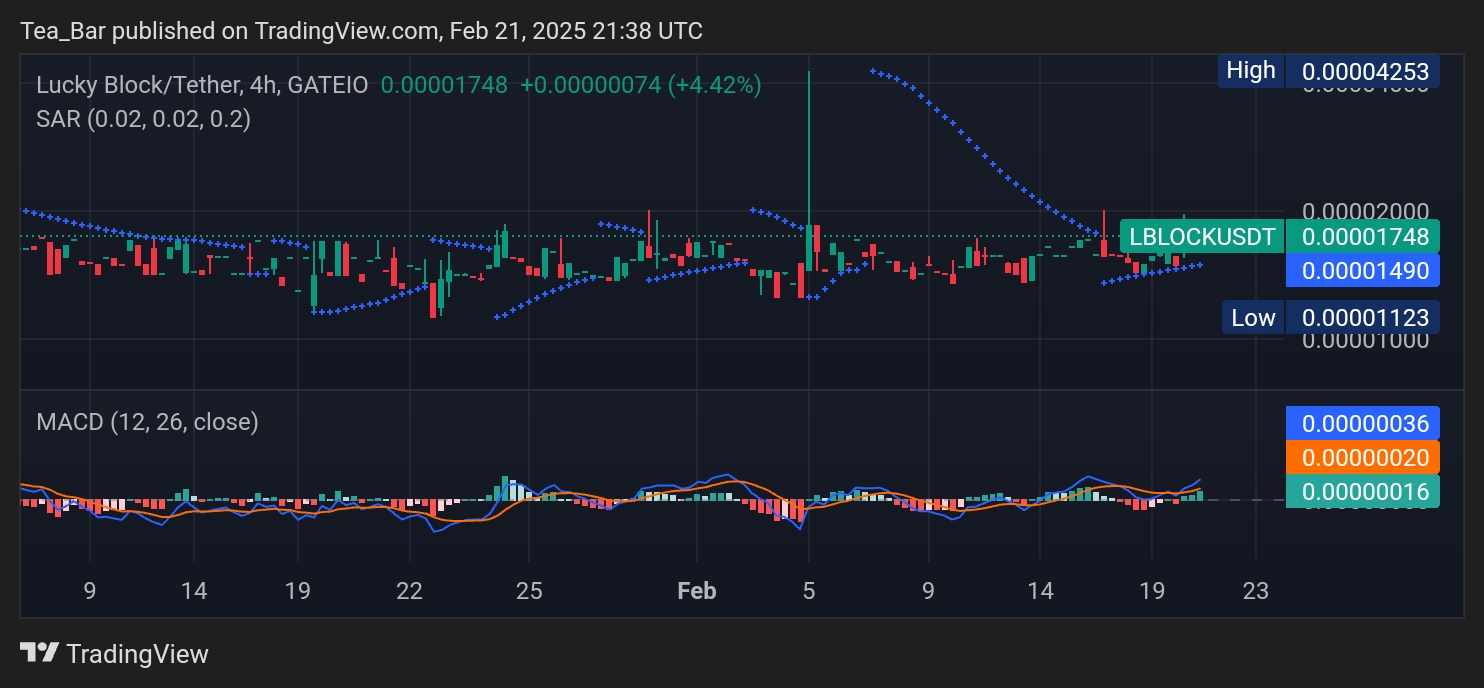
4-Hour Chart: Strengthening Uptrend
On the 4-hour chart, LBLOCK continues to consolidate but with a slight bullish inclination. The Parabolic SAR aligns with the daily trend, reinforcing a short-term uptrend. Additionally, MACD indicators show a mild increase in buying pressure, supporting further price appreciation.
The immediate support level at $0.00001490 suggests that buyers are defending this zone, setting the stage for an upward push. If momentum sustains, LBLOCK could attempt to reclaim its previous highs and continue its bullish ascent.
Conclusion: Is LBLOCK Ready for a Breakout?
The current indicators suggest that LBLOCK is positioning itself for an upward move. The growing bullish momentum, reinforced by SAR and MACD signals, points towards a potential breakout in the near term. Traders should watch for a decisive break above $0.00002826 to confirm a sustained rally.
As market sentiment continues to improve, Lucky Block could gain further traction, making it an attractive prospect for bullish investors. Keeping an eye on volume and key resistance levels will be crucial in determining the next major price movement.
Invest wisely, and let Lucky Block’s potential work in your favor. You can purchase Lucky Block here. Buy LBLOCK.