Litecoin (LTC) Price Prediction: LTC/USDT Needs to Move Higher to Attract Investors
Estimated Reading Time: 2 minutes
Don’t invest unless you’re prepared to lose all the money you invest. This is a high-risk investment and you are unlikely to be protected if something goes wrong. Take 2 minutes to learn more

Litecoin (LTC) Price Prediction (April 15, 2025)
As Bitcoin continues to push higher through previous resistance levels, other altcoins—such as Litecoin—have also shown signs of recovery. However, the market remains largely subdued, although it still appears to have the potential for future gains.
LTC/USDT Long-Term Trend: Bullish (Daily Chart)
Key Price Levels:
Resistance: $80, $85, $90
Support: $75, $70, $65
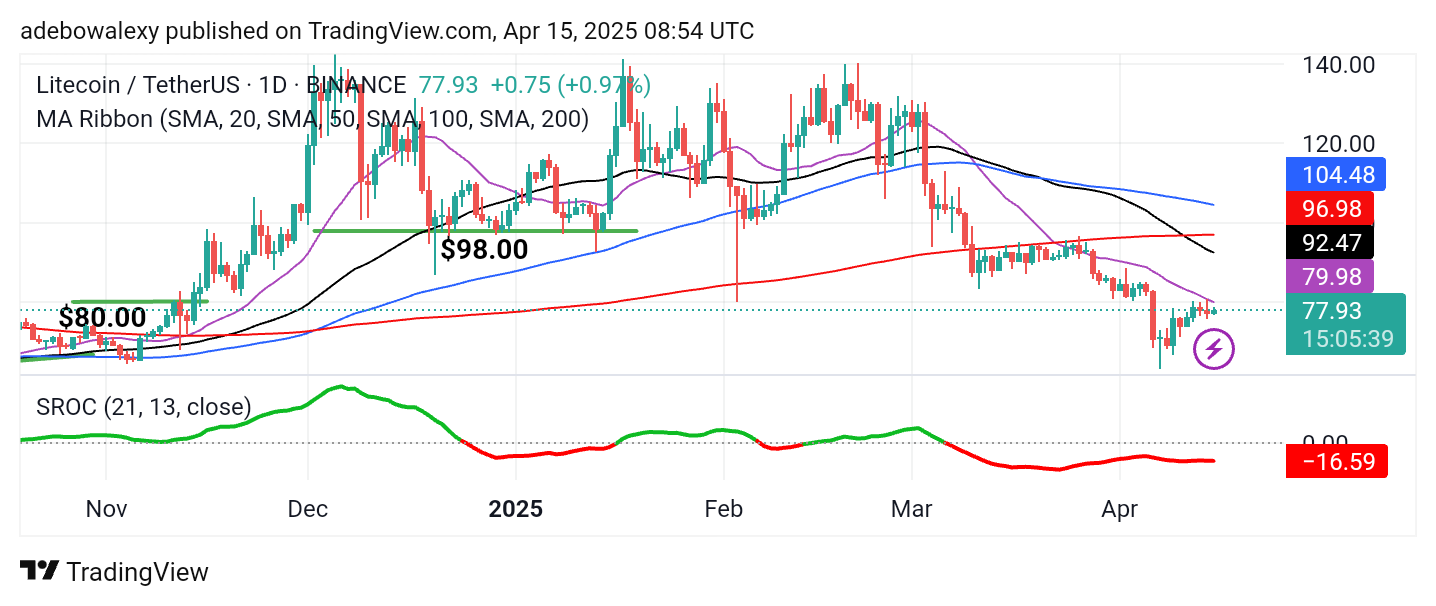
On the daily chart, Litecoin’s price action recently rebounded from the resistance formed by the 20-day Moving Average (MA) line. The most recent price candle is green, indicating a minor upward movement, though the price remains below all the MA lines on the chart. Additionally, the Stochastic Rate of Change (SROC) indicator lines are moving sideways below the equilibrium level of 0.00.
Litecoin (LTC) Price Prediction: Dip Buyers Still Active in LTC/USDT
Although the Litecoin market remains generally vulnerable, bullish forces are still attempting to push past notable resistance levels. Price action previously tested the 20-day MA line but reversed slightly over the past two sessions.
The ongoing session shows a modest upward retracement. Nevertheless, trading continues below the MA lines. The SROC indicator is hovering just below the equilibrium level, suggesting that a breakout above the 20-day MA could signal further price increases.
Litecoin (LTC) Price Prediction: Upside Momentum is Building in LTC/USDT
On the 4-hour chart, signs of bullish momentum persist. The market has previously moved above the 20-day MA and briefly surpassed the 50-day MA but has since dipped back below it in the current session. Despite this, price action remains close to the 50-day MA.
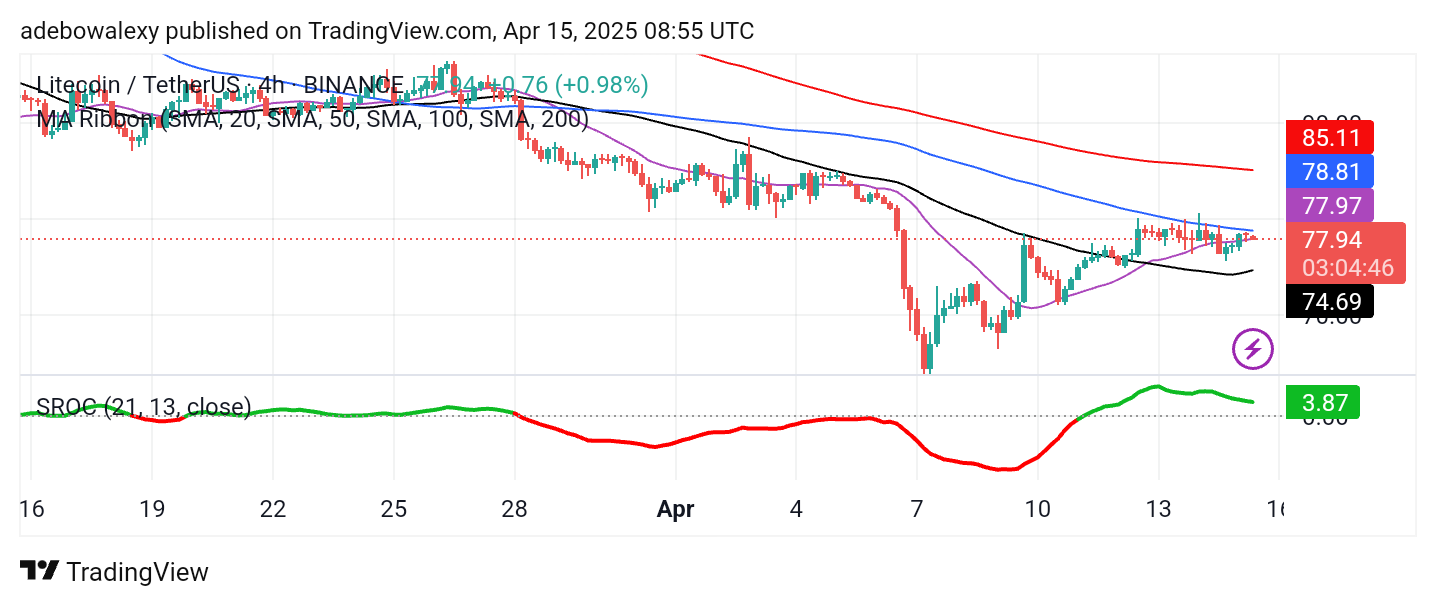
Meanwhile, the SROC curve is slightly above the 0.00 level and trending sideways. As a result, market participants may consider waiting for a confirmed move above the 50-day MA before targeting the $82 level for potential short-term gains.