SPONGE/USD ($SPONGE): Bulls Take Over the Market
Estimated Reading Time: 2 minutes
Don’t invest unless you’re prepared to lose all the money you invest. This is a high-risk investment and you are unlikely to be protected if something goes wrong. Take 2 minutes to learn more
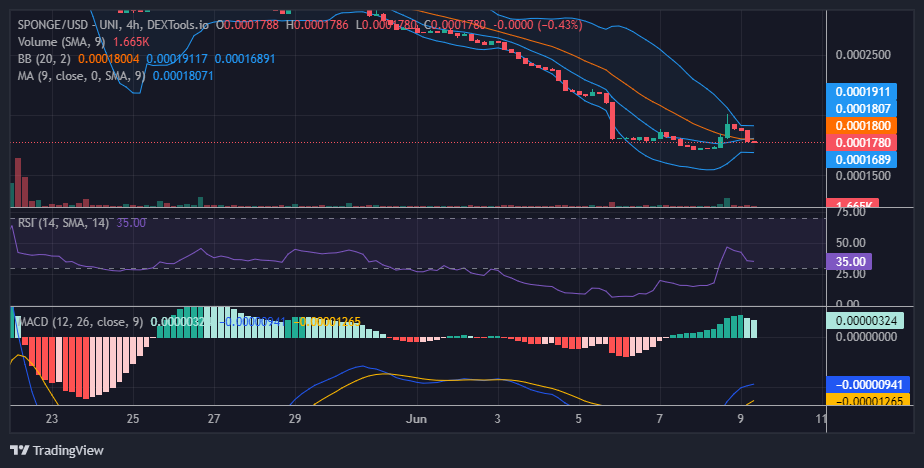
The $SPONGE bulls have been able to stop the down-trending market around the $0.0001725 price level. The bearish trend, which started as a result of a price break from the consolidation trend around the $0.00029 price level on May 30, was not a steep one due to the presence of bulls in the market.
Key Levels
- Resistance: $0.0004, $0.0045, and $0.0005.
- Support: $0.00015, $0.00014, and $0.00013.
SPONGE/USD ($SPONGE) Price Analysis: The Indicators’ Point of View
The bands of the Bolinger indicator are contracting due to $SPONGE demand catching up with supply, this suggests that we are about to see another price break out. And since the contraction of the Bollinger Bands is taking place near the bullish stronghold, that is, the $0.0001725 price level, there is more likelihood that the break out is going to be to the upside. Both the Relative Strength Index and the Moving Average Convergence and Divergence (MACD) reflect the activities of the bulls toward turning the market around.
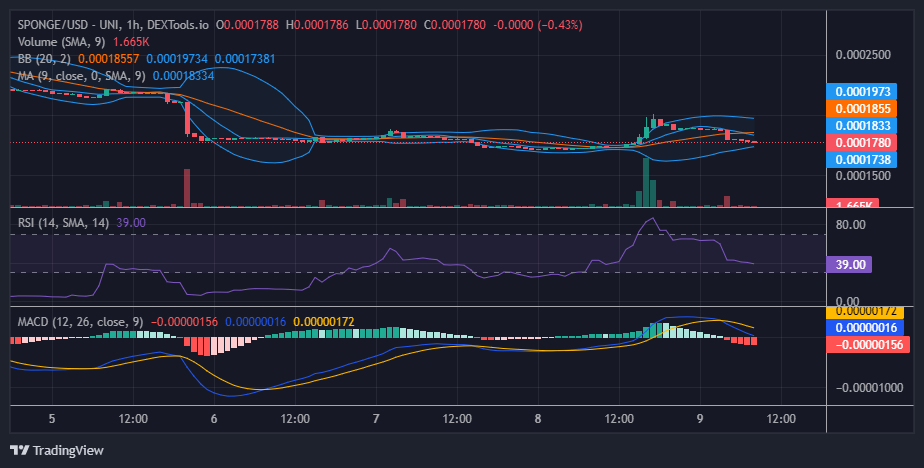
SPONGE/USD Short-Term Outlook: 1-Hour Chart
Looking at the market from the 1-hour chart perspective, we discovered that there appears to be strong bearish resistance at the $0.0002 price level. This is because long-term market holders seem to be taking their profit from around that price level. Despite this, the appearance of the candlesticks that constitute the market retracements suggests that bulls are still strong in the market and the force behind the SPONGEUSD bull market will continue to push the market to the upside.
Sponge is a hot memecoin, buy it now!
🤣 = 😂 = 😅 = 🫠 = 🥲 = 😢 = 😭 pic.twitter.com/JElKEuhBMg
— $SPONGE (@spongeoneth) June 9, 2023
Invest in the hottest and best meme coin. Buy Sponge ($SPONGE) today!