Polygon (ex-MATIC) Price Prediction: POL/USDT Takes on the $0.2000 Resistance Level
Estimated Reading Time: 3 minutes
Don’t invest unless you’re prepared to lose all the money you invest. This is a high-risk investment and you are unlikely to be protected if something goes wrong. Take 2 minutes to learn more

Polygon (ex-MATIC) Price Prediction (April 12, 2025)
The Bitcoin market has been recovering upward lately. This momentum has also spread to other cryptocurrencies, such as the POL (ex-MATIC) daily market. The POL (ex-MATIC) daily market has been able to regain a previously lost price level, and price action may likely reclaim the $0.2000 level.
POL/USDT Long-Term Trend: Bullish (Daily Chart)
Key Price Levels:
Resistance: $0.2000, $0.2500, $0.3000
Support: $0.1800, $0.1600, $0.1400
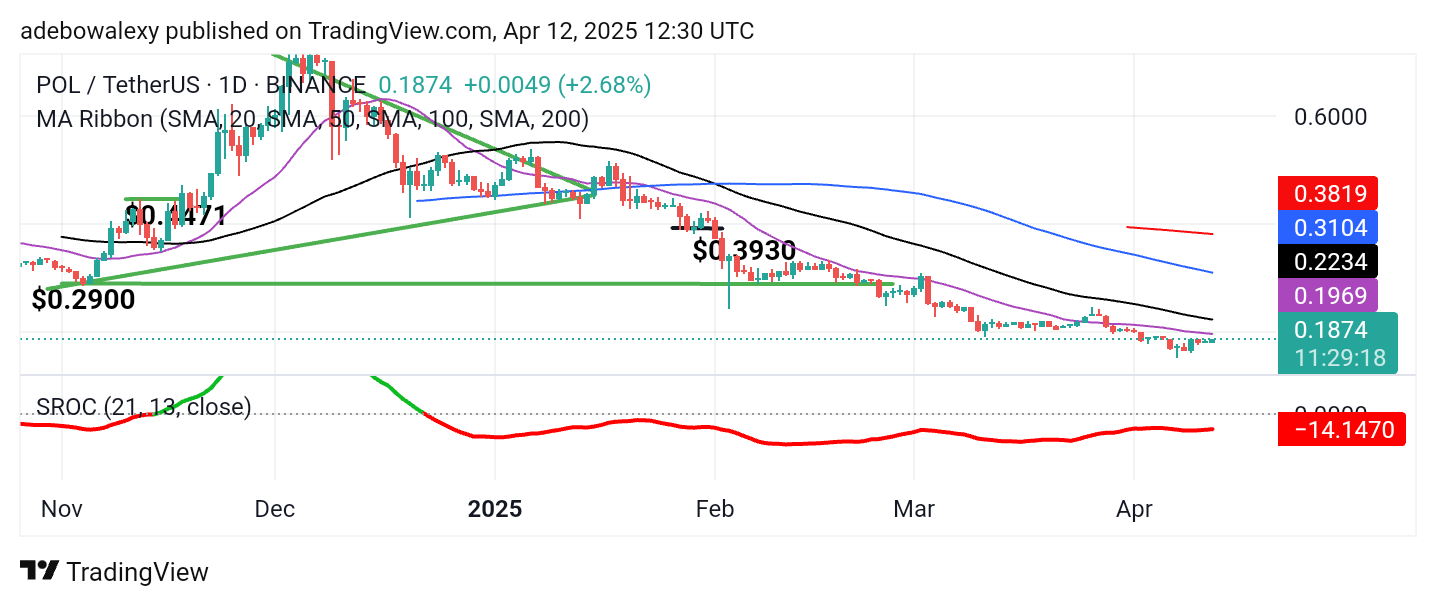
Price action in the POL (ex-MATIC) daily market has moved upward clearly. Also, the last price candle on the chart is green. However, price action remains below all the Moving Average (MA) curves on the chart. It should also be noted that the last price candle on this chart appears slightly larger than the one from the previous session. The Stochastic Rate of Change (SROC) indicator lines appear red and are positioned below the 0.00 level. However, the terminal end of these indicator lines has a slight upward slope.
Polygon (ex-MATIC) Price Prediction: POL/USDT May Surpass the 20-Day MA Curve
The POL (ex-MATIC) market descended below the 20-day MA line about two weeks ago. The market has continued downward ever since until it rebounded upward near the $0.1500 price level. Currently, price action in this market is retracing toward higher price levels.
The last price candle on this chart shows that price activity is trending toward the 20-day MA line, which is currently acting as resistance. At this point, if price action breaks above the 20-day MA line, buying activity may strengthen. The SROC line affirms that upside momentum is currently subdued. However, the upward slope of the indicator’s terminal end suggests that upward momentum may develop further.
Polygon (ex-MATIC) Price Prediction: POL/USDT Proceeds to Higher Highs on Short Time Frames
The POL (ex-MATIC) 4-hour market has been progressing from one higher support level to another, as revealed by price behavior.
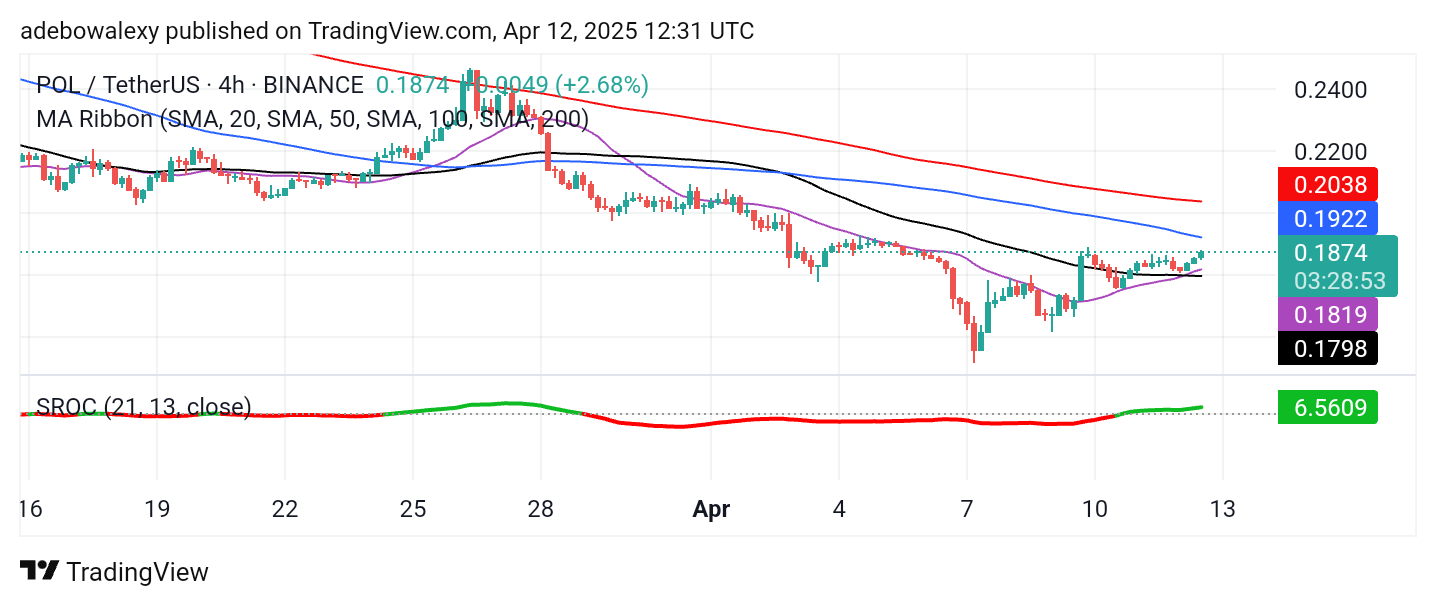
Over the past two sessions, according to this price chart, buying activity has been prevalent and has occurred above a crossover between the 20- and 50-day MA lines. In addition, the SROC line has risen above the equilibrium level and is now green. It is also tilted slightly upward, indicating that upside momentum may continue to grow. At this point, it seems likely that price action may breach the $0.2000 price level soon.