SPONGE/USD ($SPONGE) Bulls Dig in at $0.0001: Breakdown Risk Fades as Breakout Potential Grows
Estimated Reading Time: 3 minutes
Don’t invest unless you’re prepared to lose all the money you invest. This is a high-risk investment and you are unlikely to be protected if something goes wrong. Take 2 minutes to learn more

The $SPONGE market has established a strong foothold around the crucial $0.0001 level, a zone that has repeatedly repelled bearish attempts. This sustained period of consolidation underscores the significance of this price floor and suggests that the window for a downward breach is rapidly closing, while the probability of an upward breakout continues to gain momentum.
The current market action can be likened to a tightly wound mechanism, appearing still on the surface but accumulating pressure for an explosive move. Interestingly, the Bollinger Bands maintain a significant spread, a reminder of the volatility that still resides within the market. The next decisive move is anticipated to be sharp, favoring the bullish side.
Key Price Zones to Monitor
- Resistance: $0.000110, $0.000120, $0.000130
- Support: $0.000090, $0.000085, $0.000080
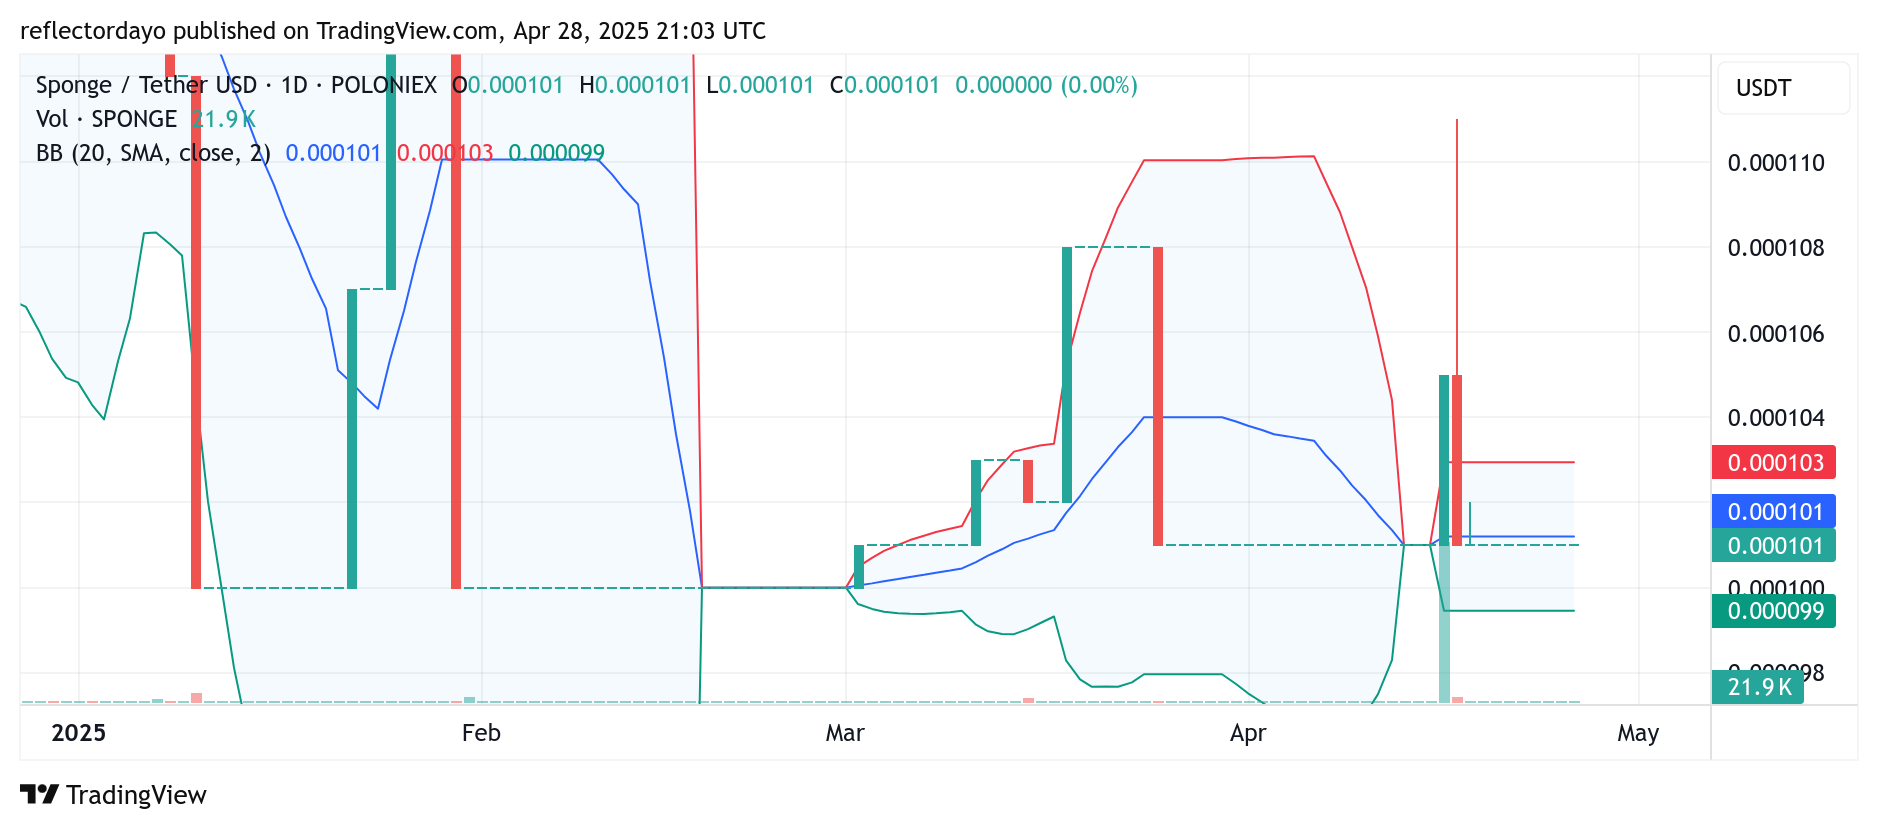
$SPONGE’s 24-Hour Picture: Support at $0.0001 Remains Unyielding Amidst Sideways Trading
Over the past day, $SPONGE’s price action has been characterized by a consistent formation of four-price doji candlesticks – small-bodied candles indicative of strong market indecision and stability. This repeated pattern highlights the resilience of the $0.0001 level as a robust support base, with prices holding firm across multiple trading sessions. Consequently, the 20-day moving average has now closely aligned with this horizontal price movement, reinforcing the narrative of sustained market equilibrium.
Despite the current lack of clear directional momentum, historical market behavior suggests that a breakdown is becoming increasingly unlikely. Instead, the present structure is laying the groundwork for a bullish breakout in the crypto signal. While price action may appear muted, the relatively wide Bollinger Bands indicate that underlying volatility persists. Traders should closely monitor any contraction of these bands, a classic signal of an impending significant move.
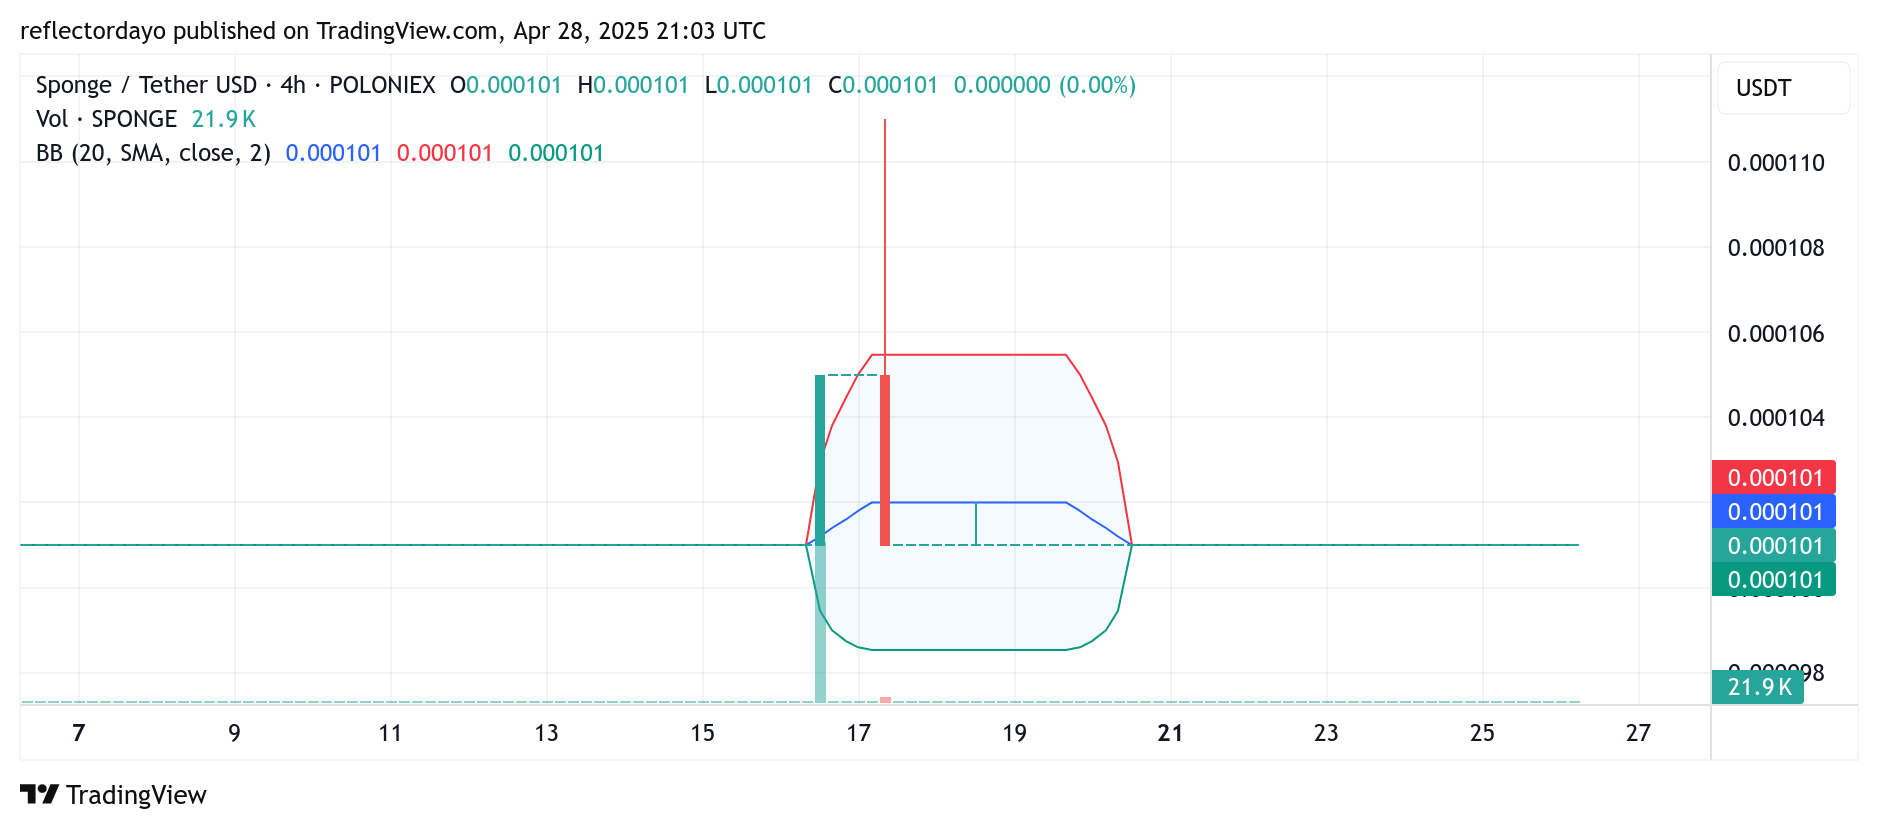
Short-Term SPONGE/USD Analysis: Price Compression on the 4-Hour Chart Points to an Imminent Breakout
Zooming in on the 4-hour timeframe reveals a compelling setup. Unlike the broader daily perspective, the 4-hour chart shows a notable tightening of the Bollinger Bands around the sideways price action, signaling significant price compression and diminishing volatility.
This contraction is often a reliable precursor to an imminent breakout, and the current technical configuration strongly suggests a bullish outcome. Traders seeking potential early entry points might find this setup particularly interesting as it precedes what could be a substantial upward move.
HODLING through the noise pic.twitter.com/g7fN7pKX0l
— $SPONGE (@spongeoneth) April 28, 2025
Join the SPONGE community and get in on the next big crypto opportunity! Buy Sponge ($SPONGE) today