SPONGE/USD ($SPONGE) Gathers Strength for an Imminent Bullish Breakout
Estimated Reading Time: 3 minutes
Don’t invest unless you’re prepared to lose all the money you invest. This is a high-risk investment and you are unlikely to be protected if something goes wrong. Take 2 minutes to learn more

The SPONGE/USD market has spent an extended period consolidating around the key $0.0001 level, which has repeatedly proven to be a firm support zone for bullish participants. This sustained stability emphasizes the critical importance of the $0.0001 price floor and suggests that the likelihood of a downward breach is diminishing, while the odds of an upward breakout continue to strengthen.
Currently, market behavior mirrors that of a “compressed spring” — relatively quiet on the surface but steadily building pressure beneath. Interestingly, the Bollinger Bands have maintained a considerable width, implying that residual volatility from previous swings remains embedded in the market. When the next move materializes, it is expected to be sharp and decisive, favoring bullish momentum.
Key Price Zones to Monitor
- Resistance: $0.000110, $0.000120, $0.000130
- Support: $0.000090, $0.000085, $0.000080
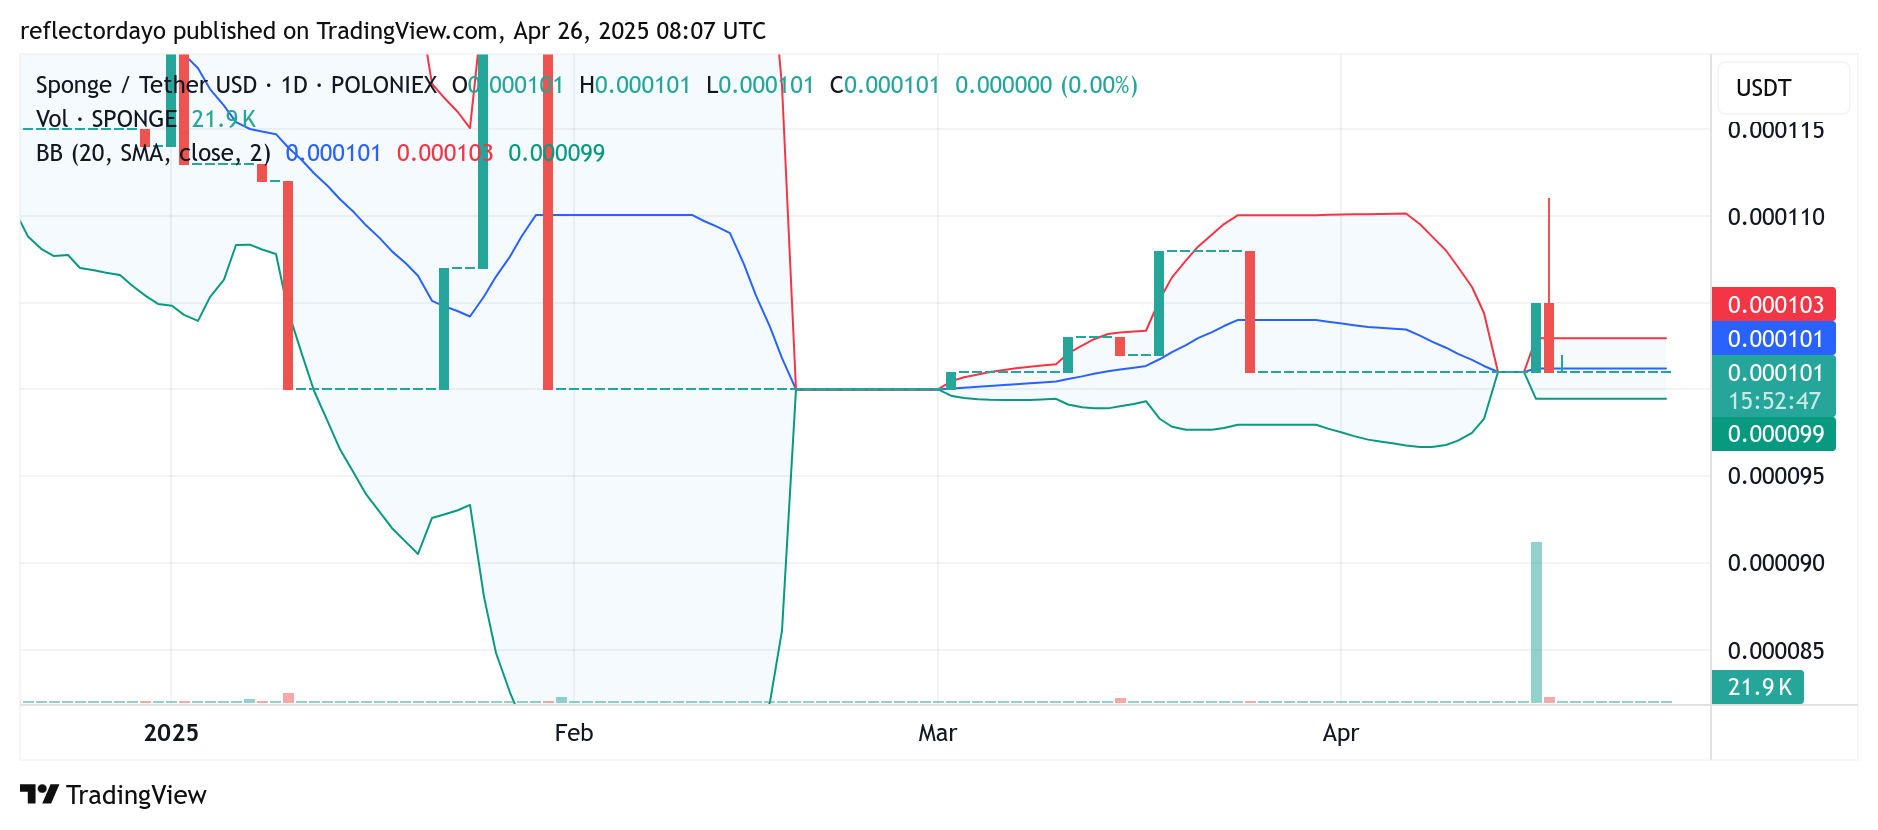
SPONGE/USD 24-Hour Technical Analysis: Bulls Fortify Support at $0.0001 Amid Sideways Drift
In the past 24 hours, SPONGE/USD has painted a consistent pattern of four-price doji candlesticks—small-bodied candles that signify intense market indecision and stability. This repeated formation highlights the resilience of the $0.0001 level as a strong base of support, with prices holding firm across multiple sessions. Consequently, the 20-day moving average has now aligned tightly with the horizontal price movement, reinforcing the notion of sustained market balance.
Despite the lack of directional momentum, historical market tendencies suggest that a breakdown is improbable. Instead, the current structure sets the stage for a bullish breakout. Although price action appears muted, the Bollinger Bands remain relatively broad, indicating that latent volatility is still present. Traders should remain attentive to any narrowing of the bands, a classic precursor to a significant move.

SPONGE/USD Short-Term Technical View: Price Compression Hints at Breakout on the 4-Hour Chart
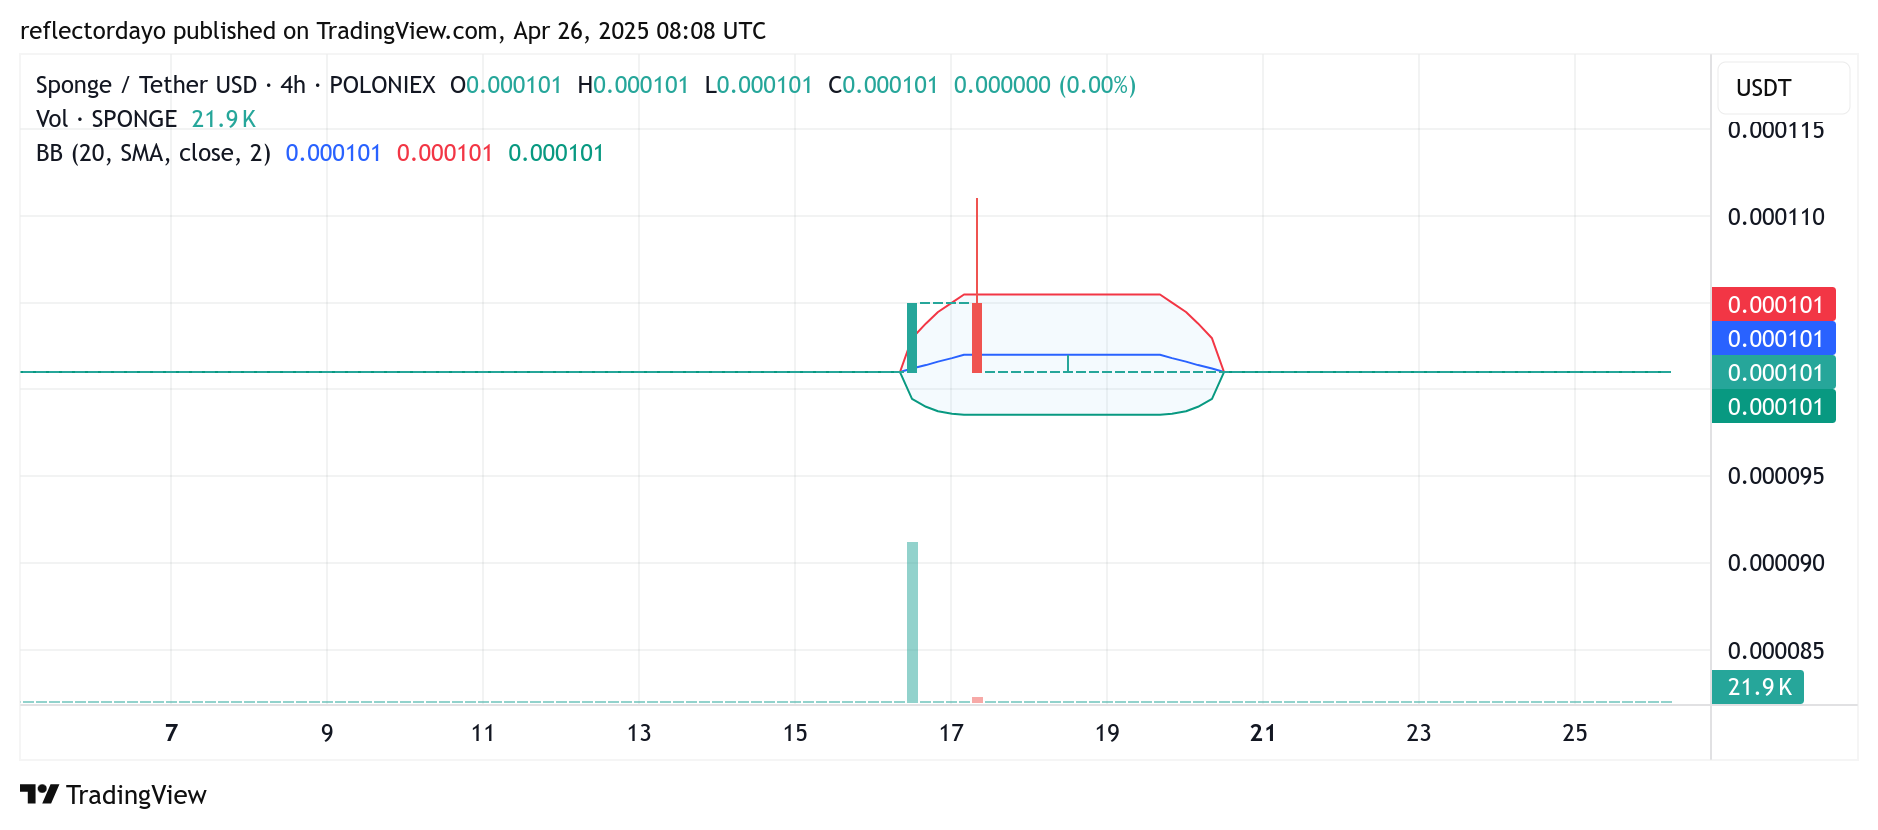
Zooming into the 4-hour timeframe, a different picture emerges. Unlike the broader daily chart, the 4-hour setup shows the Bollinger Bands tightening considerably around the sideways-moving price action, signaling pronounced price compression and decreasing volatility.
This contraction often serves as a harbinger of an imminent breakout. Given the current technical alignment, the conditions favor a bullish scenario. SPONGE/USD traders seeking early entries might view this setup as a compelling opportunity ahead of what could be a powerful upward thrust.
Buy $SPONGE!
Warren Buffet right now pic.twitter.com/e1sZShpaoG
— $SPONGE (@spongeoneth) April 25, 2025
Join the SPONGE community and get in on the next big crypto opportunity! Buy Sponge ($SPONGE) today