Chainlink Bounces as It Surpasses the Crucial $13 Support Level
Estimated Reading Time: 2 minutes
Don’t invest unless you’re prepared to lose all the money you invest. This is a high-risk investment and you are unlikely to be protected if something goes wrong. Take 2 minutes to learn more

Chainlink (LINK) Long-Term Analysis: Bearish
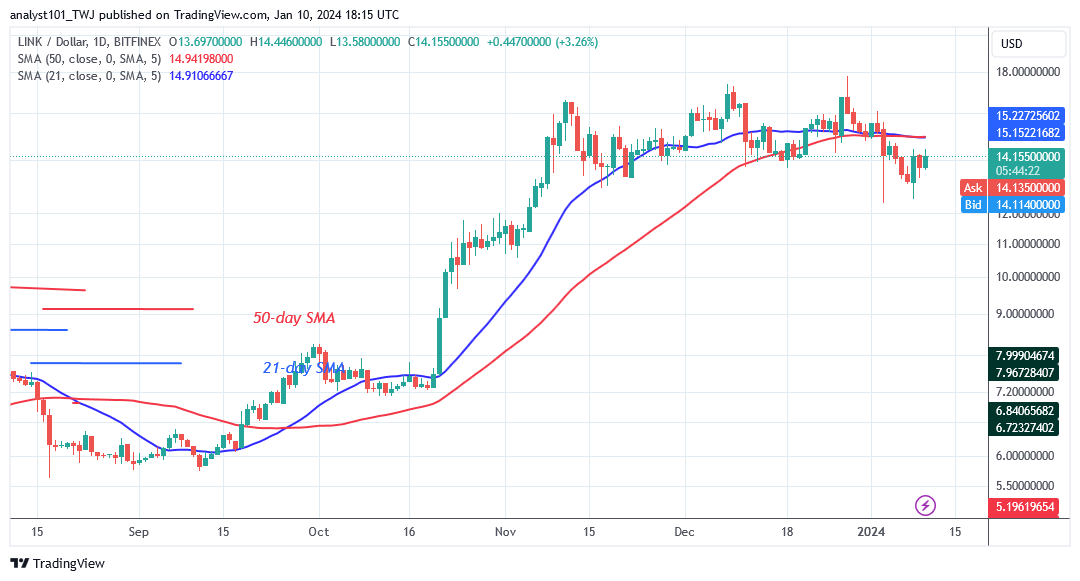
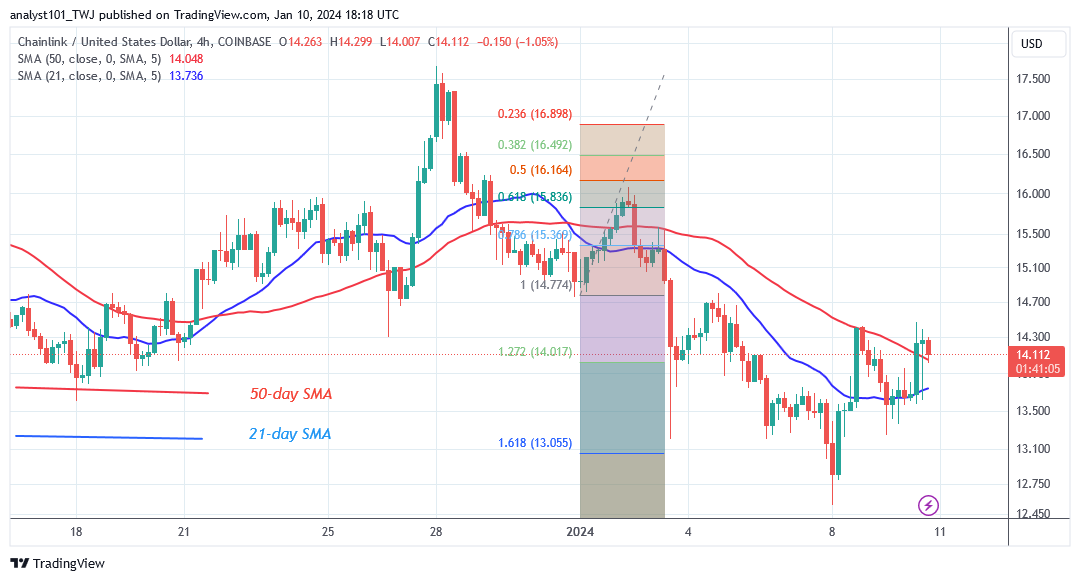
Chainlink’s (LINK) sideways trend ends as it surpasses the crucial $13 support level. The altcoin dropped to a low of $12.35 on January 3, but bulls purchased the dips. On January 8, the bears resumed their upward trajectory by testing the current support level at $12.51. The altcoin is trading at $14.13 as of this writing. The market will rise to a high of $17 if buyers maintain the price above the moving average lines.
However, purchasers have not yet broken through the $17 barrier. The $17 barrier will be breached when it hits a high of $22, which will be the culmination of the upward trend. Chainlink’s price will be turbulent on the downside, ranging from $12 to the resistance level of $15, where the optimistic scenario is invalidated.
LINK/USD is currently trading below the lines of the moving average.
Technical indicators:
Major Resistance Levels – $8.00, $10.00, $12.00
Major Support Levels – $6.00, $4.00, $2.00
Chainlink (LINK) Indicator Analysis
A possible slump is anticipated as long as the price bars stay below the moving average lines. Based on the behavior of the market, the bearish momentum has decreased as long as the altcoin keeps its support above $12. The moving average lines’ southerly slope indicates a declining trend.
What Is the Next Direction for Chainlink (LINK)?
Chainlink’s price recovers as it surpasses the crucial $13 support level. The altcoin recovered above its historical price level on November 17 after a dip. Buyers have been defending the current support level at $13 since November 17. The altcoin’s price has been bouncing between $13 and $17 since November 17.
You can purchase crypto coins here. Buy LBLOCK
Note: Cryptosignals.org is not a financial advisor. Do your research before investing your funds in any financial asset or presented product or event. We are not responsible for your investing result