SPONGE/USD ($SPONGE) Stabilizes in the Buy Zone
Estimated Reading Time: 2 minutes
Don’t invest unless you’re prepared to lose all the money you invest. This is a high-risk investment and you are unlikely to be protected if something goes wrong. Take 2 minutes to learn more
Given the hyperbullish $SPONGE market conditions observed yesterday, there was anticipation of a robust bearish market phase to follow. However, the ensuing bearish market trend was not as intense as initially projected. It appears that a support zone is taking shape approximately within the range of $0.0001080 and $0.000107. Should the bulls effectively maintain price stability within this range over a certain duration, there is potential for the bull market to sustain its momentum at this particular level.
Key Levels
- Resistance: $0.00016, $0.00017, and $0.00018.
- Support: $0.00011, $0.00010, and $0.00009.
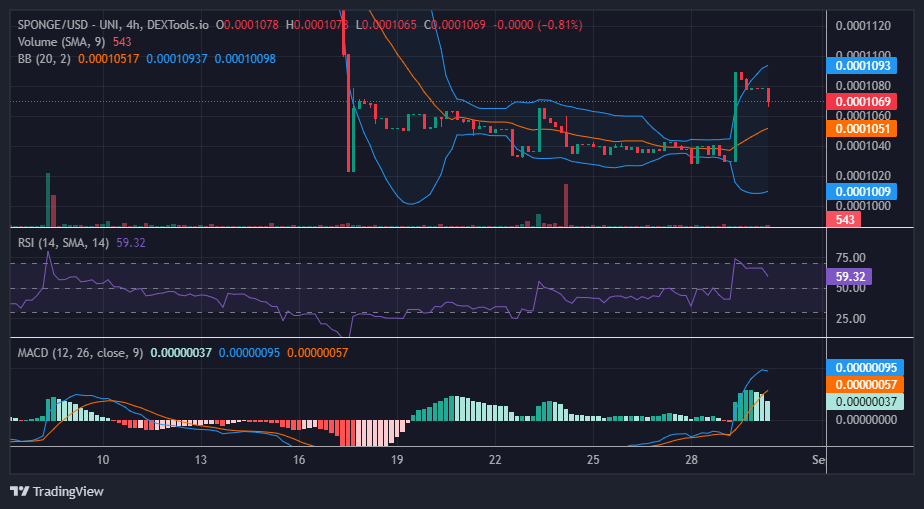
Sponge (SPONGE/USD) Price Analysis: The Indicators’ Point of View
Following the hyperbullish session, the $SPONGE market experienced a minimal bearish retracement. This retracement was unexpected, given the preceding hyperbullish movement. Typically, a strong bearish move would be anticipated after such a robust bullish phase. However, the actual price action deviated from this expectation, suggesting a potential shift in market dynamics.
The indicators continue to signal a bullish price outlook. However, regarding the Moving Average Convergence and Divergence (MACD) indicator, while the market might exhibit a bullish stance, the presence of a faded green histogram implies a weakening of the bullish momentum. This suggests that traders could be capitalizing on gains near the pivotal supply level, contributing to the observed weakening of bullish sentiment.
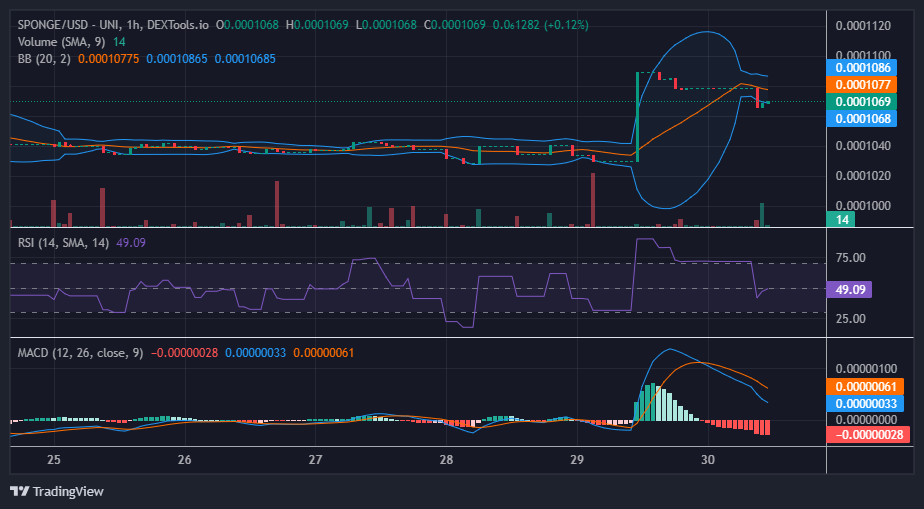
$SPONGE Short-Term Outlook: 1-Hour Chart
Analyzing the market through the 1-hour chart, a surge in trading volume becomes evident as $SPONGE rebounds from the $0.000107 support level. This signifies ample trading engagement that could sustain the bullish momentum. Should the bulls successfully secure the $0.00011 price level, the subsequent target could potentially be set at $0.000112.
Soak up the dampness in the crypto market with SPONGE/USD.
When a true #Crypto legend is born!👶🚀😂 pic.twitter.com/m5KKfh6qdF
— $SPONGE (@spongeoneth) August 30, 2023
Invest in the hottest and best meme coin. Buy Sponge ($SPONGE) today!


