SPONGE/USD ($SPONGE) The Bull Market Smashes Through Multiple Price Channels
Estimated Reading Time: 2 minutes
Don’t invest unless you’re prepared to lose all the money you invest. This is a high-risk investment and you are unlikely to be protected if something goes wrong. Take 2 minutes to learn more

The market has maintained a sideways range above the $0.0001030 price level since August 23, following the relinquishment of the $0.0001050 price level by buyers. While the market is poised for bullish activity, investor interest remains somewhat limited for the time being.
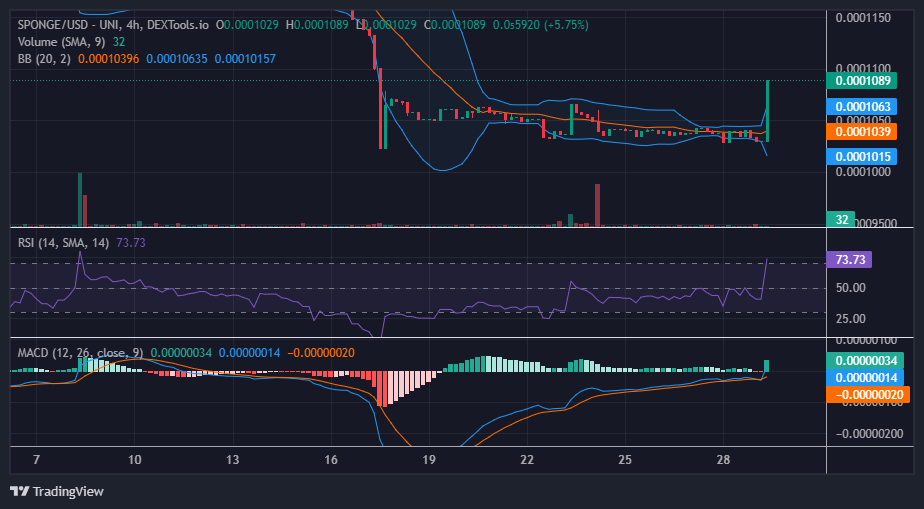
However, in today’s $SPONGE market, a shift in market dynamics favoring the bulls is evident. The bullish price movement originates from a pivotal support level and reaches a peak at the $0.000109 price level. Sustaining this robust bullish momentum would require the establishment of a stronger support level in the market.
Key Levels
- Resistance: $0.0004, $0.0045, and $0.0005.
- Support: $0.00011, $0.00010, and $0.00009.
Sponge (SPONGE/USD) Price Analysis: The Indicators’ Point of View
Examining the SPONGE/USD market through the lens of the indicator, a cause for concern becomes apparent, specifically regarding trading volume. The absence of robust trading volume to substantiate this pronounced movement is notable on the chart. Nevertheless, there is a positive aspect to consider: this potent price movement has managed to break the market’s impasse.
The Bollinger Bands have reacted to this shift in the market, with their bands expanding due to the substantial buying activity witnessed in the most recent trading session.
$SPONGE Short-Term Outlook: 1-Hour Chart
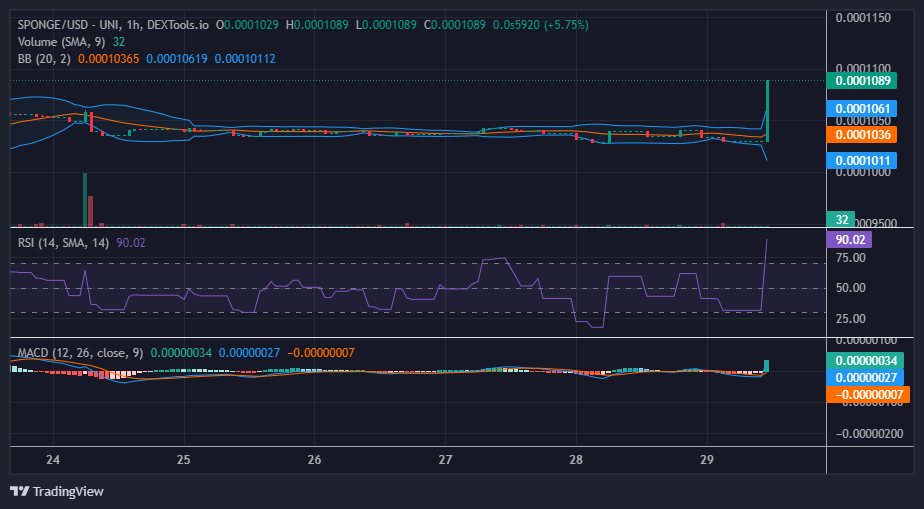
The price is ascending in an almost vertical manner. The Relative Strength Index (RSI) currently stands at 90, indicating that the market is heavily overbought. This suggests the possibility of a market correction unfolding in the upcoming trading session. If the bulls can establish a stronger support level, it will pave the way for the continuation of the bull market towards the $0.00011 mark.
SPONGE/USD is live on the MEXC Global Exchange platform.
💸 Ready to dive into $SPONGE trading on @MEXC_Official? 🎉
🚀 Trade this fascinating #MemeCoin and ride the surge with #SPONGE starting now! 🌊💪
💼 Explore: https://t.co/idowkerFqD pic.twitter.com/lC3RCs1Pnk
— $SPONGE (@spongeoneth) August 29, 2023
Invest in the hottest and best meme coin. Buy Sponge ($SPONGE) today!