Bitcoin Price Prediction: BTC/USDT Slumps Back Below $100K
Estimated Reading Time: 3 minutes
Don’t invest unless you’re prepared to lose all the money you invest. This is a high-risk investment and you are unlikely to be protected if something goes wrong. Take 2 minutes to learn more

Bitcoin Price Prediction (January 8):
The Bitcoin market recently resurfaced above the $100,000 mark. It subsequently moved upwards to trade around the $102,000 price level for a while. However, headwinds soon took control of the market, plunging it back below the psychological price level of $100,000.
BTC/USDT Long-Term Trend: Bearish (Daily Chart)
Key Price Levels:
Resistance: $97,000, $100,000, $103,000
Support: $96,000, $93,000, $90,000
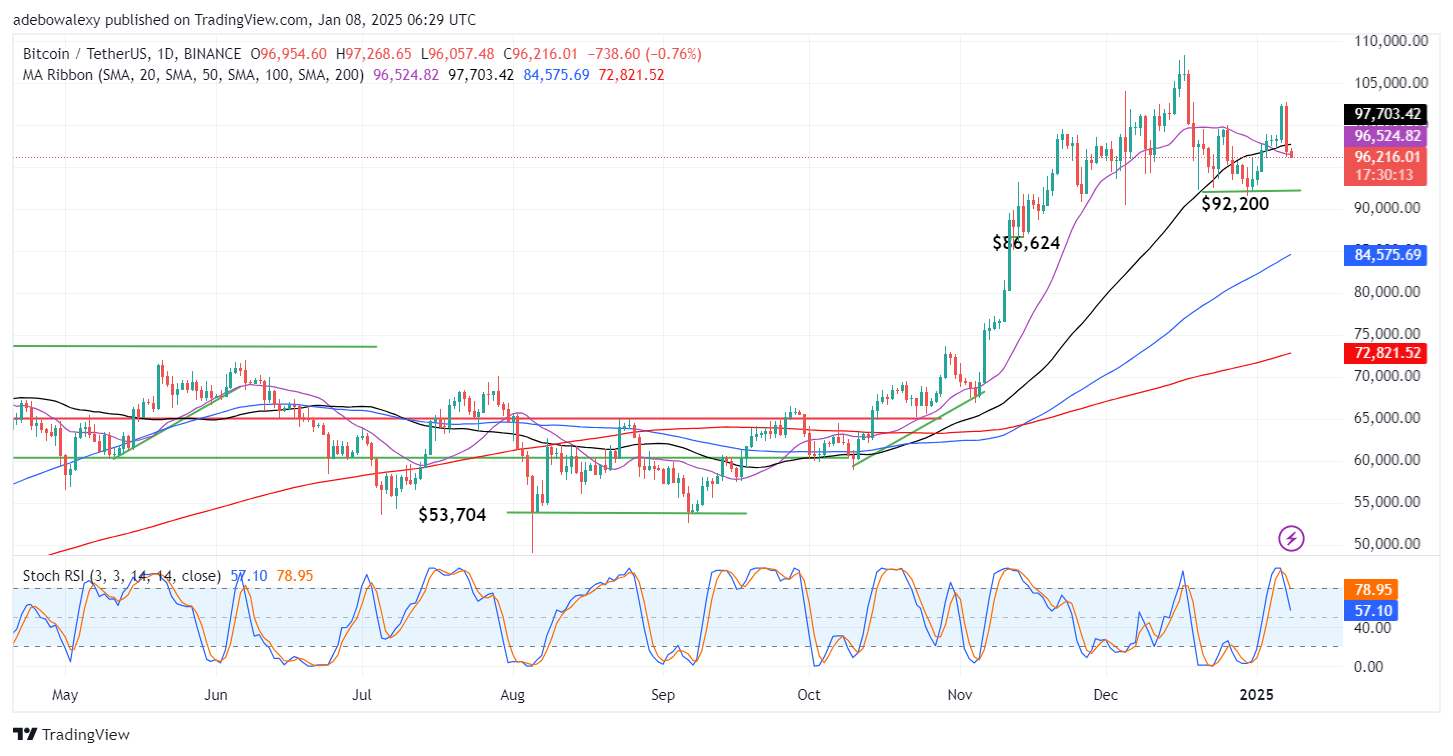
The previous session in the Bitcoin daily market witnessed a strong price decline. As a result, the token exited trading above the $100K threshold level. The ongoing session has continued in the same direction, bringing the market further below the 20-day Moving Average (MA) curve. Likewise, the Stochastic Relative Strength Index (RSI) lines are still falling steeply towards the 50 level of the indicator, without a deflection, and consistent with price movement on the chart.
Bitcoin Price Prediction: BTC/USDT Bears Stay Ahead
The Bitcoin daily market has revealed that bears are in the lead. This has stayed on since the previous session till now. And, although bearish momentum seems reduced as presented by the ongoing session, it could be seen that bearish indications are growing. The last price candle on the daily chart has brought the price below the 20-day MA line.
Consequently, this supports the fact that downward forces are getting a stronger hold of the market. Likewise, the trajectory of the Stochastic RSI lines suggests that bearish momentum is formidable and is likely to bring the market lower. In addition to that, the divergence between the lines of this indicator hints that a reversal may not occur soon.
Bitcoin Price Prediction: BTC/USDT Threatens Steeper Falls (4-Hour Chart)
Extending the Bitcoin price analysis to a 4-hour chart has pointed out that downward forces are still gaining traction. The 4-hour price chart shows that price action has descended below all the MA lines on the chart. At the same time, the Stochastic RSI lines are still falling deeply into the oversold region.
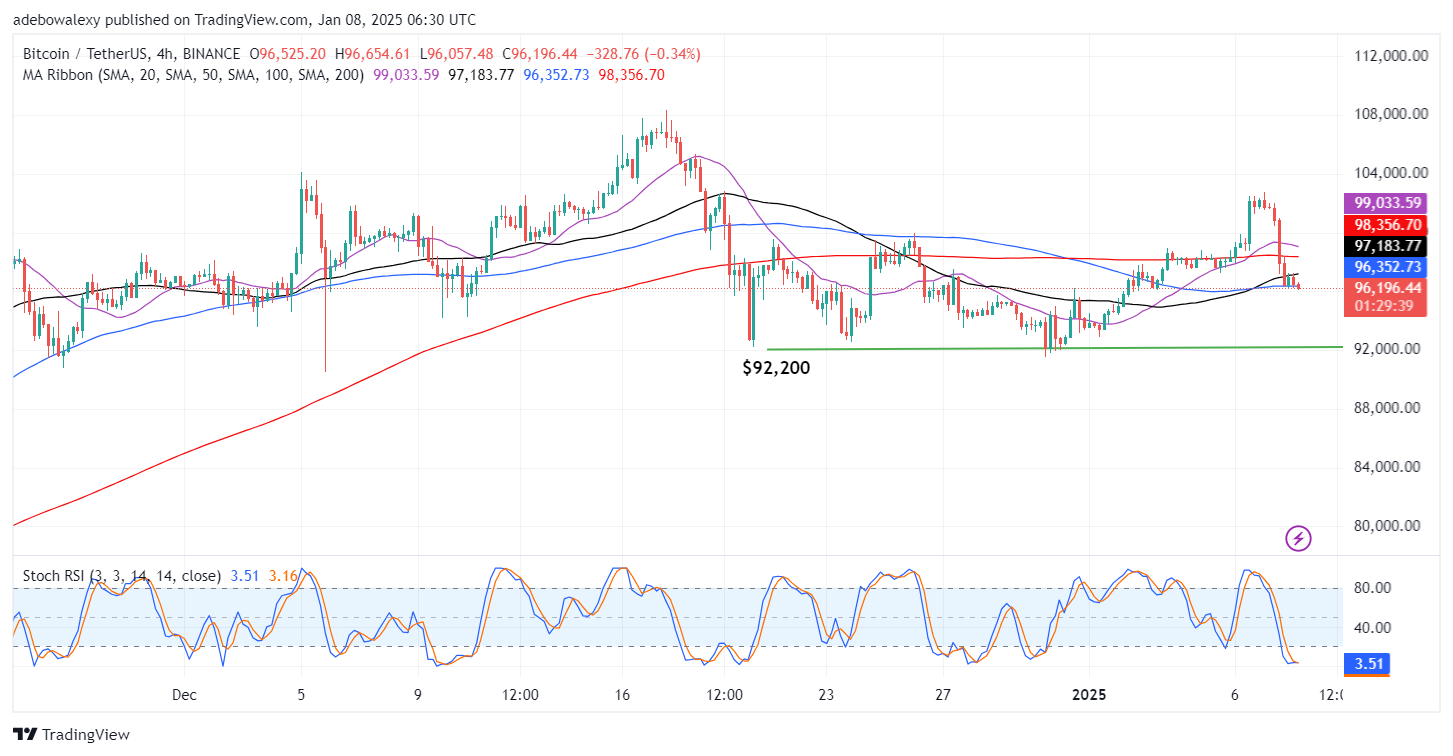
What’s more, the lines of the indicator are now merged there and are trending sideways in the oversold region. With price action now below all the MA lines and the Stochastic RSI lines merged and trending sideways in the oversold region, it seems more probable that price action may proceed below the support level at the $95,000 price mark. So, bear traders can target price levels below the $95,000 price level.